18 EMG and Muscle Fatigue LabQuest
advertisement

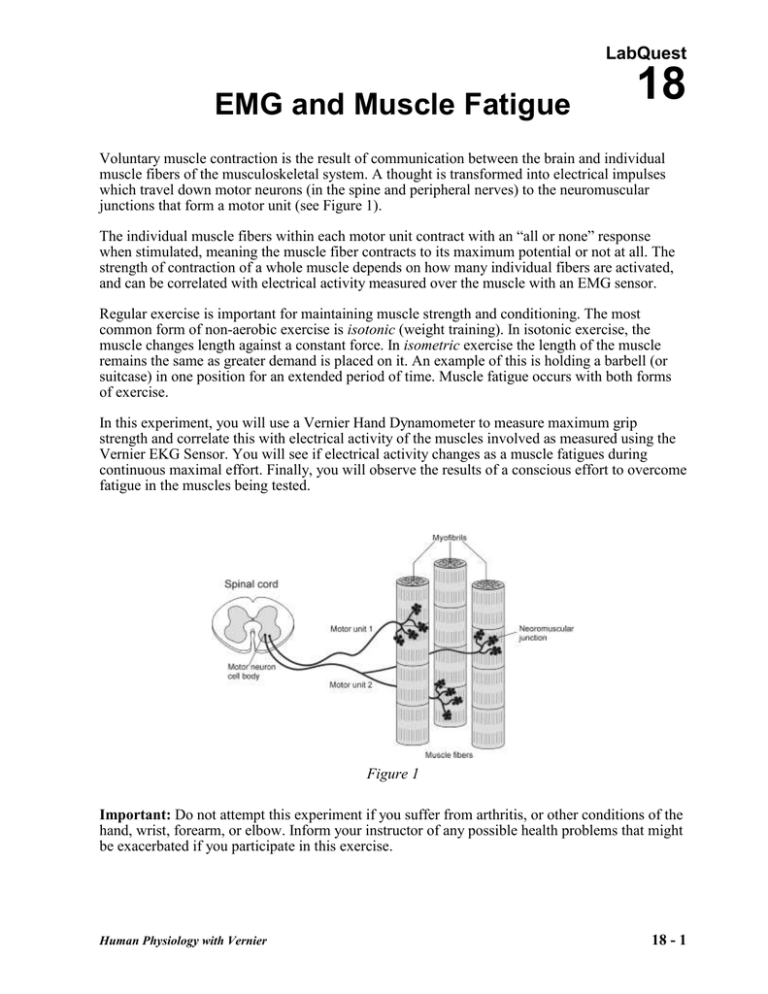
LabQuest EMG and Muscle Fatigue 18 Voluntary muscle contraction is the result of communication between the brain and individual muscle fibers of the musculoskeletal system. A thought is transformed into electrical impulses which travel down motor neurons (in the spine and peripheral nerves) to the neuromuscular junctions that form a motor unit (see Figure 1). The individual muscle fibers within each motor unit contract with an “all or none” response when stimulated, meaning the muscle fiber contracts to its maximum potential or not at all. The strength of contraction of a whole muscle depends on how many individual fibers are activated, and can be correlated with electrical activity measured over the muscle with an EMG sensor. Regular exercise is important for maintaining muscle strength and conditioning. The most common form of non-aerobic exercise is isotonic (weight training). In isotonic exercise, the muscle changes length against a constant force. In isometric exercise the length of the muscle remains the same as greater demand is placed on it. An example of this is holding a barbell (or suitcase) in one position for an extended period of time. Muscle fatigue occurs with both forms of exercise. In this experiment, you will use a Vernier Hand Dynamometer to measure maximum grip strength and correlate this with electrical activity of the muscles involved as measured using the Vernier EKG Sensor. You will see if electrical activity changes as a muscle fatigues during continuous maximal effort. Finally, you will observe the results of a conscious effort to overcome fatigue in the muscles being tested. Figure 1 Important: Do not attempt this experiment if you suffer from arthritis, or other conditions of the hand, wrist, forearm, or elbow. Inform your instructor of any possible health problems that might be exacerbated if you participate in this exercise. Human Physiology with Vernier 18 - 1 LabQuest 18 OBJECTIVES In this experiment, you will Obtain graphical representation of the electrical activity of a muscle. Correlate grip strength measurements with electrical activity data. Correlate measurements of grip strength and electrical activity with muscle fatigue. Observe the effect on grip strength of a conscious effort to overcome fatigue. MATERIALS LabQuest LabQuest App Vernier Hand Dynamometer Vernier EKG Sensor electrode tabs PROCEDURE Part I Grip Strength without Visual Feedback Select one person from your lab group to be the subject. 1. Connect the Hand Dynamometer to LabQuest and choose New from the File menu. 2. On the Meter screen, tap Length. Change the data-collection length to 100 seconds and the data-collection rate to 100 samples/second. Select OK. 3. Zero the readings for the Hand Dynamometer. a. Hold the Hand Dynamometer along the sides, in an upright position (see Figure 2). Do not put any force on the pads of the Hand Dynamometer. b. When the readings stabilize, choose Zero from the Sensors menu. The readings for the sensor should be close to zero. Figure 2 4. Attach three electrode tabs to one of your arms, as shown in Figure 3. Two tabs should be placed on the ventral forearm, 5 cm and 10 cm from the medial epicondyle along an imaginary line connecting the epicondyle and the middle finger. 5. Attach the green and red leads to the tabs on ventral forearm. For this activity, the green and red leads are interchangeable. Attach the black lead to the upper arm. Figure 3 6. Have the subject sit with his/her back straight and feet flat on the floor. The elbow should be at a 90° angle, with the arm unsupported. 7. Have the subject close his/her eyes, or avert them from the screen. 8. Instruct the subject to grip the sensor with full strength and start data collection. The subject should exert maximum effort throughout the data-collection period. 18 - 2 Human Physiology with Vernier EMG and Muscle Fatigue 9. At 80 s, the lab partner(s) should encourage the subject to grip even harder. Data will be collected for 100 s. 10. Use the force vs. time graph to determine the mean force exerted during different time intervals. a. b. c. d. Tap and drag across the data from 0 s to 20 s. Choose Statistics from the Analyze menu. Record the mean force in Table 1, rounding to the nearest 0.1 N. Choose Statistics from the Analyze menu to turn off statistics. 11. Repeat Step 10 for two other 20 second intervals: 60−80 s and 80−100 s. 12. Repeat Step 10 to record the maximum and minimum mV during three intervals on the EMG graph: 0–20 s, 60−80 s, and 80−100 s. Rounding to the nearest 0.01 mV. 13. Calculate the difference between each minimum and maximum value and record this value in the ∆mV column in Table 1. Part II Grip Strength with Visual Feedback 14. Have the subject sit with his/her back straight and feet flat on the floor. The Hand Dynamometer should be held in the same hand used in Part I of this experiment. Instruct the subject to position his/her elbow at a 90° angle, with the arm unsupported, and to close his/her eyes, or avert them from the screen. 15. Instruct the subject to grip the sensor with full strength and start data collection. The subject should exert near maximum effort throughout the duration of the experiment. 16. At 80 s, instruct the subject to watch the screen, and attempt to match his/her beginning grip strength (the level achieved in the first few seconds of the experiment) and to maintain this grip for the duration of the experiment. Data will be collected for 100 s. 17. Use the force vs. time graph to determine the mean force exerted during different time intervals. a. b. c. d. Tap and drag across the data from 0 s to 20 s. Choose Statistics from the Analyze menu. Record the mean force in Table 1, rounding to the nearest 0.1 N. Choose Statistics from the Analyze menu to turn off statistics. 18. Repeat Step 17 for two other 20 second intervals: 60−80 s and 80−100 s. 19. Repeat Step 18 to record the maximum and minimum mV during three intervals on the EMG graph: 0–20 s, 60−80 s, and 80−100 s. Rounding to the nearest 0.01 mV. 20. Calculate the difference between each minimum and maximum value and record this value in the ∆mV column in Table 1. Human Physiology with Vernier 18 - 3 LabQuest 18 Part III Repetitive Grip Strength 21. Have the subject sit with his/her back straight and feet flat on the floor. The Grip Strength Sensor should be held in the same hand used in Parts I and II of this experiment. Instruct the subject to position his/her elbow at a 90° angle, with the arm unsupported, and to close his/her eyes, or avert them from the screen. 22. Instruct the subject to rapidly grip and relax his/her grip on the sensor (approximately twice per second). Start data collection. The subject should exert maximum effort throughout the duration of data collection. 23. At 80 s, the lab partner(s) should encourage the subject to grip even harder. Data will be collected for 100 s. 24. Use the force vs. time graph to determine the mean force exerted during different time intervals. a. b. c. d. Tap and drag across the data from 0 s to 20 s. Choose Statistics from the Analyze menu. Record the mean force in Table 1, rounding to the nearest 0.1 N. Choose Statistics from the Analyze menu to turn off statistics. 25. Repeat Step 24 for two other 20 second intervals: 60−80 s and 80−100 s. 26. Repeat Step 24 to record the maximum and minimum mV during three intervals on the EMG graph: 0–20 s, 60−80 s, and 80−100 s. Rounding to the nearest 0.01 mV. 27. Calculate the difference between each minimum and maximum value and record this value in the ∆mV column in Table 1. 18 - 4 Human Physiology with Vernier EMG and Muscle Fatigue DATA Table 1–Continuous Grip Strength without Visual Feedback Mean grip strength (N) Time Interval EMG Data Max (mV) Min (mV) ∆mV 0–20 s 60–80 s 80–100 s Table 2–Continuous Grip Strength with Visual Feedback Time Interval Mean grip strength (N) EMG data Max (mV) Min (mV) ∆mV 0–20 s 60–80 s 80–100 s Table 3–Repetitive Grip Strength Time interval Mean grip strength (N) EMG data Max (mV) Min (mV) ∆mV 0–20 s 60–80 s 80–100 s DATA ANALYSIS 1. Use the data in Table 1 to calculate the percent loss of grip strength that occurs between the 0–20 s and 60–80 s intervals. Describe a situation in which such a loss of grip strength is noticeable in your day-to-day life. 2. Use the data in Table 1 to calculate the percent change in amplitude (∆mV) in electrical activity that occurs between the 0–20 s and 60–80 s intervals. Do the same for grip strength. What accounts for the difference in the percent change observed in grip strength and ∆mV for the two time intervals? Human Physiology with Vernier 18 - 5 LabQuest 18 3. Compare mean grip strengths and ∆mV for the 0–20 s and 80–100 s in Table 1. Do your findings support or refute the practice of “coaching from the sidelines” at sporting events? 4. Use the graphs and your data from Table 1 to explain how our neuromuscular systems attempt to overcome fatigue during heavy work or exercise. How might fatigue increase the risk of musculoskeletal injury? 5. Compare the data in Tables 1 and 2. Explain any differences seen in the 80-100 s time intervals between the two tables. What does this tell you about the brain’s role in fatigue? 6. The mean grip strength is much less for repetitive gripping (Table 3) because repetitive relaxation of the hand is averaged into the calculation. a. Compare your mean grip strength during the 0–20 s and 80–100 s time intervals in Tables 1 and 3. Was there a difference in your ability to recover strength with coaching during continuous vs. repetitive gripping? b. Calculate the percent change in mean grip strength between the 1–20 s and 60–80 s time intervals in Tables 1 and 3. Do your answers support brief relaxation of muscles to delay fatigue? 18 - 6 Human Physiology with Vernier


