Chemistry 161 Measurement and Density Lab Introduction
advertisement
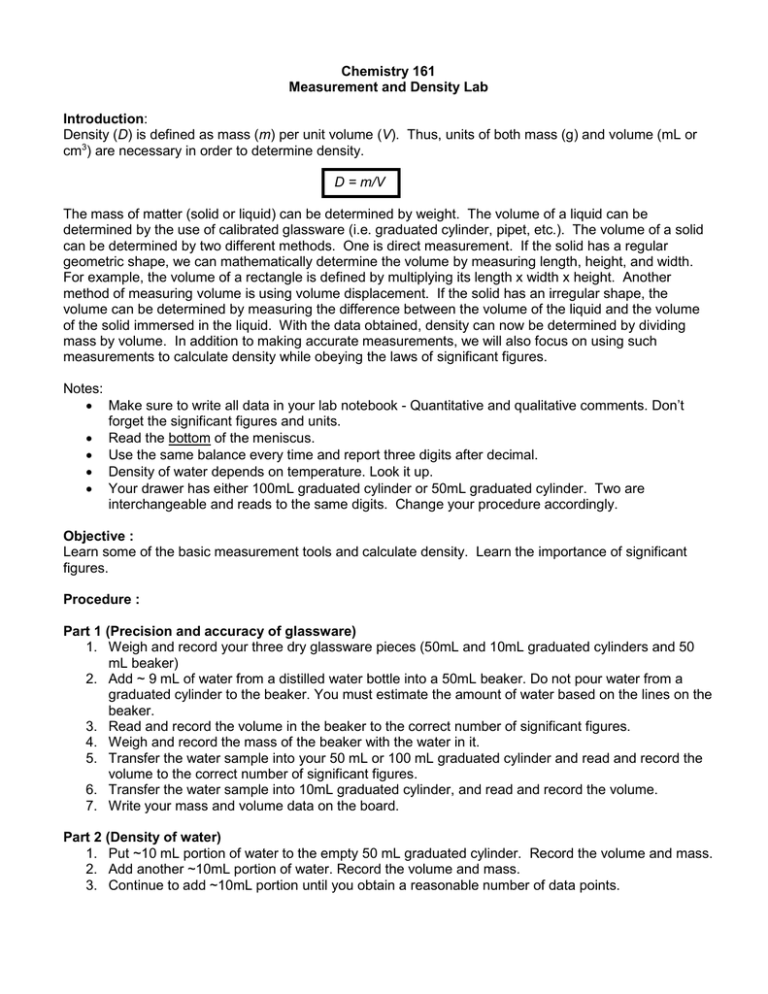
Chemistry 161 Measurement and Density Lab Introduction: Density (D) is defined as mass (m) per unit volume (V). Thus, units of both mass (g) and volume (mL or cm3) are necessary in order to determine density. D = m/V The mass of matter (solid or liquid) can be determined by weight. The volume of a liquid can be determined by the use of calibrated glassware (i.e. graduated cylinder, pipet, etc.). The volume of a solid can be determined by two different methods. One is direct measurement. If the solid has a regular geometric shape, we can mathematically determine the volume by measuring length, height, and width. For example, the volume of a rectangle is defined by multiplying its length x width x height. Another method of measuring volume is using volume displacement. If the solid has an irregular shape, the volume can be determined by measuring the difference between the volume of the liquid and the volume of the solid immersed in the liquid. With the data obtained, density can now be determined by dividing mass by volume. In addition to making accurate measurements, we will also focus on using such measurements to calculate density while obeying the laws of significant figures. Notes: Make sure to write all data in your lab notebook - Quantitative and qualitative comments. Don’t forget the significant figures and units. Read the bottom of the meniscus. Use the same balance every time and report three digits after decimal. Density of water depends on temperature. Look it up. Your drawer has either 100mL graduated cylinder or 50mL graduated cylinder. Two are interchangeable and reads to the same digits. Change your procedure accordingly. Objective : Learn some of the basic measurement tools and calculate density. Learn the importance of significant figures. Procedure : Part 1 (Precision and accuracy of glassware) 1. Weigh and record your three dry glassware pieces (50mL and 10mL graduated cylinders and 50 mL beaker) 2. Add ~ 9 mL of water from a distilled water bottle into a 50mL beaker. Do not pour water from a graduated cylinder to the beaker. You must estimate the amount of water based on the lines on the beaker. 3. Read and record the volume in the beaker to the correct number of significant figures. 4. Weigh and record the mass of the beaker with the water in it. 5. Transfer the water sample into your 50 mL or 100 mL graduated cylinder and read and record the volume to the correct number of significant figures. 6. Transfer the water sample into 10mL graduated cylinder, and read and record the volume. 7. Write your mass and volume data on the board. Part 2 (Density of water) 1. Put ~10 mL portion of water to the empty 50 mL graduated cylinder. Record the volume and mass. 2. Add another ~10mL portion of water. Record the volume and mass. 3. Continue to add ~10mL portion until you obtain a reasonable number of data points. Part 3 (Metal density) 1. Weigh your solid sample(s). - Don’t put anything directly on the balance pan. 2. Using the most precise equipment from part 1, measure the volume of the solid sample by water displacement. 3. Dry your solid and put it back on the cart. Part 4 (Density of salt water) 1. Obtain one of the colored salt solutions. 2. Using the most precise and accurate piece of glassware from part 1, measure/calculate the density of colored salt water. Prelab Questions : a. What is the density of water to 3 significant figures when the temperature is 21.0 C? b. You are given a beaker that contains 4.59 cm3 of a metallic solid. The total mass of the beaker is 35.66 g. The empty beaker weighs 14.23 g. What is the density of the solid? c. Mercury is traded by the “flask”, a unit that has a mass of 34.5 kg. What is the volume of a flask of mercury if the density of mercury is 13.6 g/mL? d. Calculate the density of solid using the following data. Mass of solid = 2.576 g Volume of water without solid = 3.99 mL Volume of water with solid = 8.99 mL Postlab (handwritten in your labnotebook) Clearly report your results, any graphs, tables, and answers to your postlab questions. Include statements for any problems/errors encountered, and of what you learned from this lab. Data and Analysis: Part 1 – Make sure to copy the class data from the board into a clear table. Use an Excel spreadsheet to calculate your class average and standard deviation. i. Calculate the density of water for each run that used the 50 mL beaker. Calculate the average density and the standard deviation. Then calculate % error. ii. Calculate the density of water for each run that used 100ml graduated cylinder. Calculate the average density and the standard deviation. Then calculate % error. iii. Calculate the density of water for each run that used 10ml graduated cylinder. Calculate the average density and the standard deviation. Then calculate % error. Part 2 – Use Excel or other spreadsheet program to create your graphs iv. Plot the data in a way that the mass in on the y-axis and volume is on the x-axis. Clearly label your y and x axes, and the title on your graph. v. Include a best fitted line using your data points. vi. Put all of your information together and write in the equation of the line with correct units on your graph. Put a box around it so it will be easily found. Part 3 vii. viii. ix. Write down all given choices. Calculate the density of your unknown solid. Identify your unknown. Part 4 x. Calculate the density of your colored salt water. Post Lab Questions: Be specific in your answers. Explaining “it won’t be accurate.”, “it would be off.” or “it would be wrong.” is not sufficient. I am looking for specific detailed answers such as: “the density would be lower, because the mass is lower, while the volume remains constant.” Part 1: 1. What is the theoretical volume for your ~9 g of water, calculated from the mass you measured, and the density of water that you looked up? 2. Which of the glass cylinders (10mL or 50mL) was the most accurate for measuring the volume of water? Which was the most precise? Explain. Part 2: 3. What does the slope of your graph represent? Report the value with correct units and sig figs. 4. What would your graph look like if your masses included the weight of the container each time (i.e. you did not set the scale to zero after putting the empty container on the balance)? Sketch one graph and draw what it would look like with and without the weight of the container. Label property. Which part of y=mx+b would that change? Part 3: 5. In the volume displacement method, why is it important not to have air bubbles? 6. Why is it important not to simply drop the solid into the water carelessly? 7. What would happen to the density of the solid if water splashed out from the container as you dropped the solid in? 8. Consider measuring the volume of two different metal samples with the same graduated cylinder. One has an actual measurement of 25.25 mL and the other has an actual measurement of 1.32 mL. Which do you expect to have the greater percent error? Explain. 9. What would happen to the accuracy and precision of your solid density if you used a 5.000 gram sample versus a 0.050 gram sample? Is a larger or smaller sample better to use in terms of precision and accuracy? Explain. Part 4: 10. Which has higher density, fresh water or salt water? Summary: Handwrite the following tables and lists in your lab notebook to report your summary results. Part 1 Mass Volume Density Class Class Class Theoretical (yours) (yours) (yours) Average Std. % Error Density Density Deviation 50 mL beaker 50 mL grad.cyl. 10 mL grad.cyl. Part 2 State the page number where to find your graph. D from your graph _________ Y=mx+b from your graph ____________ Part 3 Unknown # ________ Qualitative observation of your unknown __________ Mass __________ volume __________ Density ___________ ID ___________ Theoretical density ___________ Part 4 Unknown # ________ Color of solution ___________ Mass __________ volume __________ Density ___________

