DRAFT Annual St. Albans Watershed Phosphorus Mass Balance November 9, 2005
advertisement

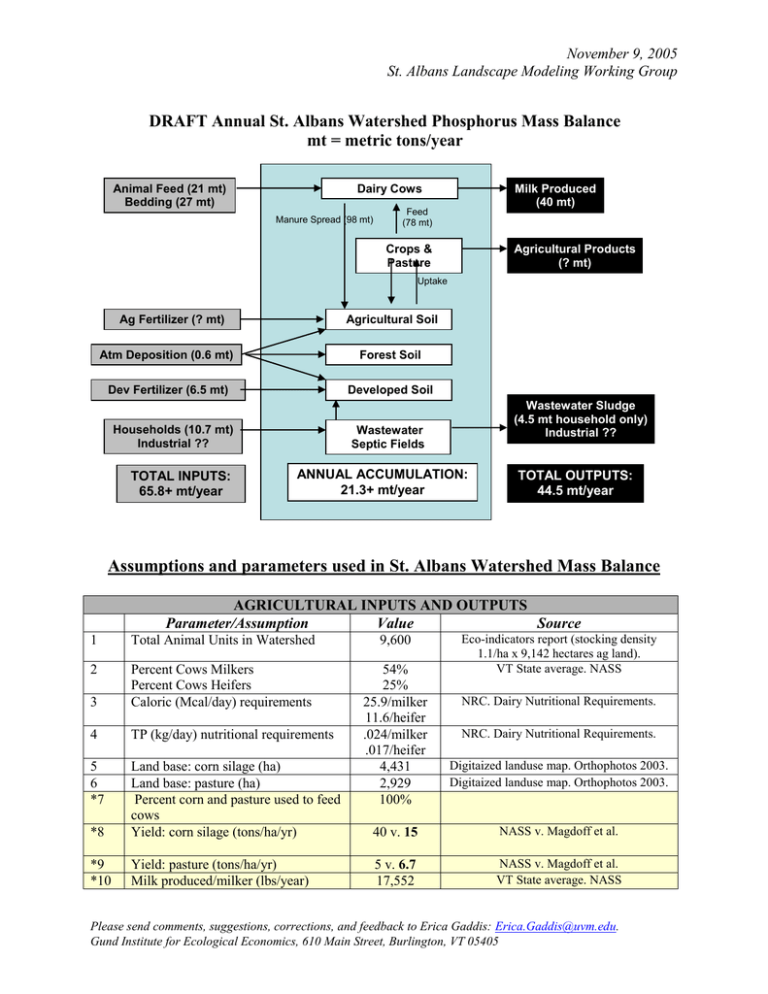
November 9, 2005 St. Albans Landscape Modeling Working Group DRAFT Annual St. Albans Watershed Phosphorus Mass Balance mt = metric tons/year Animal Feed (21 mt) Bedding (27 mt) Dairy Cows Manure Spread (98 mt) Milk Produced (40 mt) Feed (78 mt) Crops & Pasture Agricultural Products (? mt) Uptake Ag Fertilizer (? mt) Agricultural Soil Atm Deposition (0.6 mt) Forest Soil Dev Fertilizer (6.5 mt) Developed Soil Households (10.7 mt) Industrial ?? TOTAL INPUTS: 65.8+ mt/year Wastewater Sludge (4.5 mt household only) Industrial ?? Wastewater Septic Fields ANNUAL ACCUMULATION: 21.3+ mt/year TOTAL OUTPUTS: 44.5 mt/year Assumptions and parameters used in St. Albans Watershed Mass Balance AGRICULTURAL INPUTS AND OUTPUTS Parameter/Assumption Value Source 1 Total Animal Units in Watershed 9,600 2 3 Percent Cows Milkers Percent Cows Heifers Caloric (Mcal/day) requirements 4 TP (kg/day) nutritional requirements 5 6 *7 *8 Land base: corn silage (ha) Land base: pasture (ha) Percent corn and pasture used to feed cows Yield: corn silage (tons/ha/yr) 54% 25% 25.9/milker 11.6/heifer .024/milker .017/heifer 4,431 2,929 100% *9 *10 Yield: pasture (tons/ha/yr) Milk produced/milker (lbs/year) Eco-indicators report (stocking density 1.1/ha x 9,142 hectares ag land). VT State average. NASS NRC. Dairy Nutritional Requirements. NRC. Dairy Nutritional Requirements. Digitaized landuse map. Orthophotos 2003. Digitaized landuse map. Orthophotos 2003. 40 v. 15 NASS v. Magdoff et al. 5 v. 6.7 17,552 NASS v. Magdoff et al. VT State average. NASS Please send comments, suggestions, corrections, and feedback to Erica Gaddis: Erica.Gaddis@uvm.edu. Gund Institute for Ecological Economics, 610 Main Street, Burlington, VT 05405 November 9, 2005 St. Albans Landscape Modeling Working Group *11 *12 Bedding/AU (lbs/day) Percent bedding imported to watershed 4 100% Cassell and Watzin ATMOSPHERIC DEPOSITION Parameter/Assumption Value 13 14 Atmospheric deposition (kg/ha/year) Hectares in watershed of TP 0.044 14,697 Source National atmospheric deposition program (AIRmon) Derived using GIS watershed delineation RESIDENTIAL AND COMMERCIAL FERTILIZERS Parameter/Assumption Value Source 15 *16 17 18 19 20 Average fertilizer applied to lawn (kg/ha/application) Average applications/year Percent of fertilizer that is phosphorus Commercial landuse (ha) Residential landuse (ha) Percent of residences that fertilize Commercial landscape = lawn (%) Residential landscape = lawn (%) Parameter/Assumption 21 22 23 *24 181 3 3% 71 1052 41% 40% 86% HOUSEHOLDS Value TP for food and household products (grams/person/day) People in the watershed Percent watershed households in city Phosphorus removal of wastewater treatment plant 2 14,642 44% 93% Scotts recommendation 18 lbs/5000 ft2 Guess. Could get better number of survey. Scotts typical fertilizer sold in 05478 Digitaized landuse map. Orthophotos 2003. Survey 2004 of St. Albans City residents. Reverse of impervious cover assumptions. Source EPA 2000. Onsite wastewater treatment systems manual City of St. Albans: Census 2000 + Outside city: e911 households x 2.67 pe/house E911 spatial database of households. Influent = 7 mg/l (typical ww influent) Effluent = 0.5 mg/l (permit) MISSING DATA FOR MASS BALANCE Parameter/Assumption Value Suggested Source *25 *26 *27 *28 Average fertilizer applied to agricultural lands. By soil type or in total. Other agricultural products exported from watershed. NRCS files for representative farmers? Average value from Bourdeau Brothers (J. Chamberlin)? Use percentage of Franklin County values based on watershed area or percent agricultural land? Industrial inputs and outputs. Other inputs or outputs? Please send comments, suggestions, corrections, and feedback to Erica Gaddis: Erica.Gaddis@uvm.edu. Gund Institute for Ecological Economics, 610 Main Street, Burlington, VT 05405


