assignment instructions
advertisement

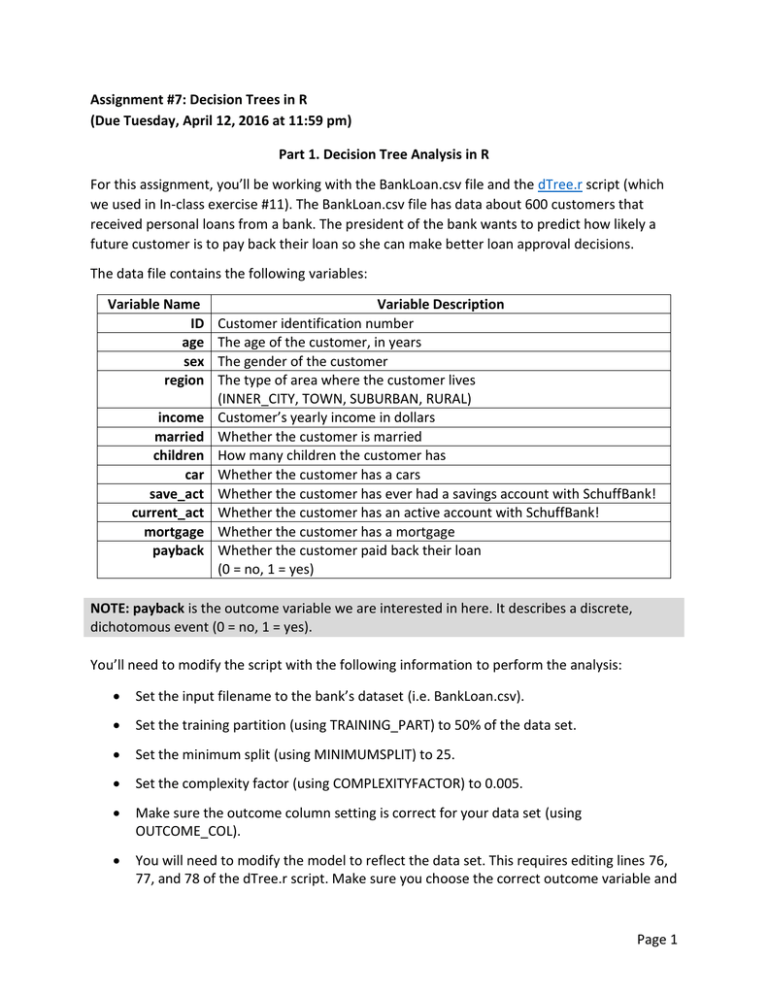
Assignment #7: Decision Trees in R (Due Tuesday, April 12, 2016 at 11:59 pm) Part 1. Decision Tree Analysis in R For this assignment, you’ll be working with the BankLoan.csv file and the dTree.r script (which we used in In-class exercise #11). The BankLoan.csv file has data about 600 customers that received personal loans from a bank. The president of the bank wants to predict how likely a future customer is to pay back their loan so she can make better loan approval decisions. The data file contains the following variables: Variable Name ID age sex region income married children car save_act current_act mortgage payback Variable Description Customer identification number The age of the customer, in years The gender of the customer The type of area where the customer lives (INNER_CITY, TOWN, SUBURBAN, RURAL) Customer’s yearly income in dollars Whether the customer is married How many children the customer has Whether the customer has a cars Whether the customer has ever had a savings account with SchuffBank! Whether the customer has an active account with SchuffBank! Whether the customer has a mortgage Whether the customer paid back their loan (0 = no, 1 = yes) NOTE: payback is the outcome variable we are interested in here. It describes a discrete, dichotomous event (0 = no, 1 = yes). You’ll need to modify the script with the following information to perform the analysis: Set the input filename to the bank’s dataset (i.e. BankLoan.csv). Set the training partition (using TRAINING_PART) to 50% of the data set. Set the minimum split (using MINIMUMSPLIT) to 25. Set the complexity factor (using COMPLEXITYFACTOR) to 0.005. Make sure the outcome column setting is correct for your data set (using OUTCOME_COL). You will need to modify the model to reflect the data set. This requires editing lines 76, 77, and 78 of the dTree.r script. Make sure you choose the correct outcome variable and Page 1 you exclude the variables which are inappropriate for the analysis. (HINT: ID is irrelevant to the analysis.) Once you finish modifying the script, you can set the working directory and run the script. Based on your script output, answer the following questions by completing the answer sheet at the end of this document): (NOTE: When asked “how likely…” cite the percentage!) 1) How often will this tree make a correct prediction (include decimals)? 2) How likely is a customer to pay back their loan if they have one child and make $35,000 per year? 3) How likely is a customer to pay back their loan if they are married, make $45,000 per year, have no children, and no mortgage? 4) How likely is a customer to pay back their loan if they make $83,000 per year and have no children? 5) Describe the profile of the least likely customer to successfully repay their loan. 6) Describe the profile of the most likely customer to successfully repay their loan. Now change the complexity factor from 0.005 to 0.05 and re-run the script. Using the new tree, answer the following questions: 7) How many leaf nodes are in the new tree? 8) Is this model better or worse than the first model at predicting who will repay their loan? Explain how changing the complexity factor affected the tree using no more than two sentences. 9) How likely is a customer to pay back their loan if they have one child and make $35,000 per year? 10) Does marriage increase or decrease the likelihood that a customer will pay back their loan? Page 2 Part 2. Compute and Evaluate Decision Trees Consider the following based on a different data set than what you have done so far in this assignment. 11) Suppose we run the decision tree algorithm and get a decision tree (called it Tree #1): compute the correct classification rate based on the following confusion matrix (Compute it by hand. No need to use R/RStudio): Predicted outcome: Observed outcome: 1 0 1 660 51 0 189 1100 Total: 2000 Table 1. Confusion Matrix (Tree #1) 12) Suppose we re-run the decision tree algorithm and get another decision tree (called it Tree #2): compute the correct classification rate based on the following confusion matrix (Compute it by hand. No need to use R/RStudio): Predicted outcome: Observed outcome: 1 0 1 821 62 0 301 816 Total: 2000 Table 2. Confusion Matrix (Tree #2) 13) Which decision tree (Tree #1 versus Tree #2) has higher classification accuracy? What to submit: The completed, working R script that produced the analysis with the complexity factor set to 0.05 in Part 1. The output file “DecisionTreeOutput.txt” and “TreeOutput.pdf” for the analysis with the complexity factor set to 0.05 in Part 1. The completed answer sheet provided on the last page (for Q1-Q10 in Part 1 and Q11-Q13 in Part 2). Note: Do not send me a ZIP or RAR file! Page 3 Answer Sheet for Assignment: Decision Trees in R Name __________________________________ Fill in the answer sheet below with the answers to the questions on pages 2 and 3 of the assignment: Question Answer 1 2 3 4 5 6 7 8 9 10 11 12 13 Page 4


