Rubenstein
advertisement

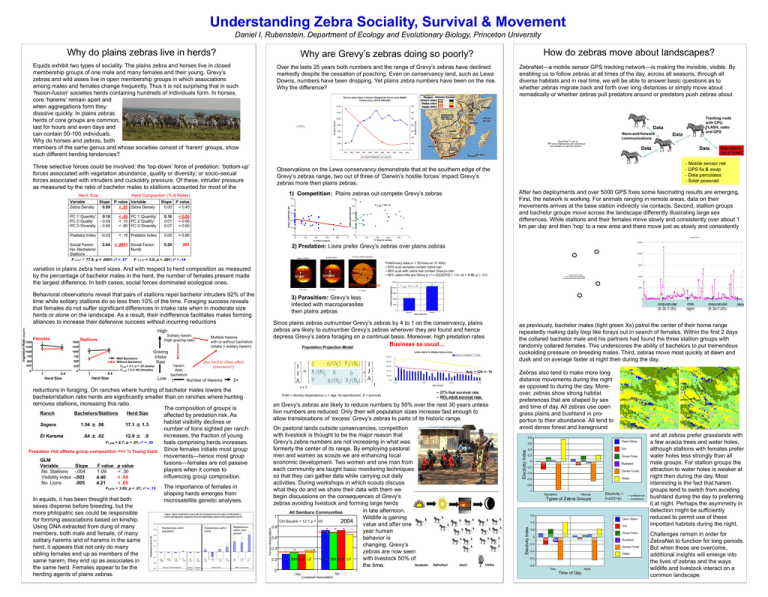
Understanding Zebra Sociality, Survival & Movement Daniel I. Rubenstein, Department of Ecology and Evolutionary Biology, Princeton University Why are Grevy’s zebras doing so poorly? Why do plains zebras live in herds? Equids exhibit two types of sociality. The plains zebra and horses live in closed membership groups of one male and many females and their young. Grevy’s zebras and wild asses live in open membership groups in which associations among males and females change frequently. Thus it is not surprising that in such ‘fission-fusion’ societies herds containing hundreds of individuals form. In horses, core ‘harems’ remain apart and when aggregations form they dissolve quickly. In plains zebras herds of core groups are common, last for hours and even days and can contain 50-100 individuals. Why do horses and zebras, both members of the same genus and whose societies consist of ‘harem’ groups, show such different herding tendencies? Over the lasts 25 years both numbers and the range of Grevy’s zebras have declined markedly despite the cessation of poaching. Even on conservancy land, such as Lewa Downs, numbers have been dropping. Yet plains zebra numbers have been on the rise. Why the difference? < .05 PC 1:‘Quantity’ < .10 PC 2:‘Quality’ < .60 PC 3:‘Diversity 0.16 0.01 0.07 < 0.05 < 0.90 < 0.50 Predator Index -0.03 < .15 Predator Index 0.00 < 0.90 600 10,000 500 8,000 400 6,000 300 4,000 200 2,000 100 1995 1996 1997 < .0001 Social Factor: Numb F 4,227 0.5 0.5 0.4 0.4 0.3 0.2 0.1 0 (bites/hr) 1000 1000 750 750 500 250 500 0 1 2-4 0 With Bachelors Without Bachelors F3,89 = 3.1; p < .05 (males) F3,142 = 2.3; NS (females) 2-4 Low Herd Size Herd Size 2003 2004 Lewa GZ F 1,39 = .05; ns 0.3 0.2 0.1 0.2 0.4 0.6 0.8 1 0 0.2 0.4 0.6 % Grevy's zebras Cuticle larger 0.8 1 smaller Preliminary data (n = 50 lions on 31 kills): • 93% scat samples contain zebra hair • 68% scat with zebra hair contain Grevy’s hair • 56% zebra kills are Grevy’s ==> (E[GZ/PZ] = 1/4: c2 = 8.96; p < .01) 2500 3) Parasitism: Grevy’s less infected with macroparasites then plains zebras 2000 F 1,29 = 8.6; p < .007 3000 Sex: F 2.29 = .40; NS Reproductive Class: F 2.29 = 1.09; NS 2500 1500 2000 1000 1500 Plains Zebra 1000 500 500 0 0 Grevy's Plains BreedingLactating Non- BreedingLactating NonMale Female Lactating Male Female Lactating Female Female Age/Reproductive Class Zebra Species Since plains zebras outnumber Grevy’s zebras by 4 to 1 on the conservancy, plains zebras are likely to outnumber Grevy’s zebras wherever they are found and hence depress Grevy’s zebra foraging on a continual basis. Moreover, high predation rates Business as usual… Population Projection Model as previously, bachelor males (light green Xs) patrol the center of their home range repeatedly making daily loop like forays out in search of females. Within the first 2 days the collared bachelor male and his partners had found the three stallion groups with randomly collared females. This underscores the ability of bachelors to put tremendous cuckolding pressure on breeding males. Third, zebras move most quickly at dawn and dusk and on average faster at night then during the day. LEWA GREVY'S ZEBRA POPULATION BIRTHS FEMALES TOTAL 500.00 Join herd to offset affect (Insurance?) harem With bachelors 1 400.00 300.00 200.00 Avg. = 326 +/- 10 100.00 2+ Number of Harems 0.00 0.00 10.00 20.00 30.00 The importance of females in shaping herds emerges from microsatellite genetic analyses. F3,678 = 3.89; p < .01; r2 = .18 Figure . Mean relatedness scores (R) and standard errors for pairs of individuals in various demographic categories from the Sweetwaters plains zebra population (n=37) 0.5 Relatedness within population 0.4 Relatedness Score (R) In equids, it has been thought that both sexes disperse before breeding, but the more philopatric sex could be responsible for forming associations based on kinship. Using DNA extracted from dung of many members, both male and female, of many solitary harems and of harems in the same herd, it appears that not only do many sibling females end up as members of the same harem, they end up as associates in the same herd. Females appear to be the herding agents of plains zebras. Relatedness within core groups Relatedness within herds 0.3 0.2 0.1 0 -0.1 All M-M (666) (171) F-M F-F (342) (153) All All All (627) (655) (39) Across Herds Across core M-M (7) F-M (22) F-F (10) All F-M (11) (7) F-F (2) -0.2 -0.3 Across 37 SW individuals Within Herds -- 27% foal survival rate -- 88% adult survival rate (Lewa’s foal patrol and program MARK) …Grevy’s numbers decline gradually on Grevy’s zebras are likely to reduce numbers by 50% over the next 30 years unless lion numbers are reduced. Only then will population sizes increase fast enough to allow translocations of ‘excess’ Grevy’s zebras to parts of its historic range. Within Core groups 0 Yes No Livestock Association Day 0.8 Open Grass 0.6 Electivity Index On pastoral lands outside conservancies, competition with livestock is thought to be the major reason that Grevy’s zebra numbers are not increasing in what was formerly the center of its range. By employing pastoral men and women as scouts we are enhancing local economic development. Two women and one man from each community are taught basic monitoring techniques so that they can gather data while carrying out daily activities. During workshops in which scouts discuss what they do and we share their data with them we begin discussions on the consequences of Grevy’s zebras avoiding livestock and forming large herds in late afternoon. All Samburu Communities 1 Wildlife is gaining Chi Square = 12.1 p < .05 2004 value and after one 0.8 + = + year human 0.6 behavior is changing: Grevy’s 0.4 = + zebras are now seen with livestock 50% of TM BM NLF LF 0.2 TM BM NLF LF Asubuhi the time. Zebras also tend to make more long distance movements during the night as opposed to during the day. Moreover, zebras show strong habitat preferences that are shaped by sex and time of day. All zebras use open grass plains and bushland in proportion to their abundance. All tend to avoid dense forest and bareground 0.4 Dirt 0.2 Grass-Trees 0 Bushland -0.2 Dense Forest -0.4 Water -0.6 -0.8 -1 Bachelors Harems Types of Zebra Groups Electivity = (r-p)/(r+p) + preference - avoidance 0.6 Open Grass 0.4 Electivity Index < .05 (F(N) = density dependence; = age 1st reproduction; S = survival) Percent Association 4.21 QuickTime™ and a TIFF (LZW) decompressor are needed to see this picture. 3500 Grevy's Zebra Medulla Cortex Multiple harems with or without bachelors (intake ≈ solitary harem) reductions in foraging. On ranches where hunting of bachelor males lowers the bachelor/stallion ratio herds are significantly smaller than on ranches where hunting removes stallions, increasing this ratio. The composition of groups is Ranch Bachelors/Stallions Herd Size affected by predation risk. As habitat visibility declines or Segera 1.54 ± .06 17.1 ± 1.3 number of lions sighted per ranch increases, the fraction of young El Karama .64 ± .02 12.9 ± .9 F1,256 = 6.7; p < .01; r2 = .28 foals comprising herds increases. Predation risk affects group composition ==> % Young foals Since females initiate most group movements—hence most group GLM fusions—females are not passive Variable Slope F value p value players when it comes to No. Stallions -.004 1.09 < .30 influencing group composition. Visibility index -.003 4.40 < .04 .005 - Mobile sensor net - GPS fix & swap - Data percolates - Solar powered After two deployments and over 5000 GPS fixes some fascinating results are emerging. First, the network is working. For animals ranging in remote areas, data on their movements arrives at the base station indirectly via contacts. Second, stallion groups and bachelor groups move across the landscape differently illustrating large sex differences. While stallions and their females move slowly and consistently over about 1 km per day and then ‘hop’ to a new area and there move just as slowly and consistently TIME (YEARS) No. Lions Base station (car or plane) = 3.0; p < .001; r2 = .14 Grazing Intake Rate 1 2002 Data 2) Predation: Lions prefer Grevy’s zebras over plains zebras .001 Solitary harem (high grazing rate) 250 2001 NUMBERS 1250 Ingestion Rate 1250 Data Data 0 0 High 1500 2000 1) Competition: Plains zebras out-compete Grevy’s zebras Behavioral observations reveal that pairs of stallions repel bachelor intruders 92% of the time while solitary stallions do so less then 10% of the time. Foraging success reveals that females do not suffer significant differences in intake rate when in moderate size herds or alone on the landscape. As a result, their indifference facilitates males forming alliances to increase their defensive success without incurring reductions Stallions 1500 QuickTime™ and a TIFF (Uncompressed) decompressor are needed to see this picture. Observations on the Lewa conservancy demonstrate that at the southern edge of the Grevy’s zebras range, two out of three of ‘Darwin’s hostile forces’ impact Grevy’s zebras more then plains zebras. variation in plains zebra herd sizes. And with respect to herd composition as measured by the percentage of bachelor males in the herd, the number of females present made the largest difference. In both cases, social forces dominated ecological ones. Females Store-and-forward communications Tracking node with CPU, FLASH, radio and GPS Speed (m/min) F 4,227 = 77.9; p < .0001; r2 = .67 0.24 1999 Parasite Load (eggs/gram) 2.44 1998 Kenya's Rangelands % Plains zebras Social Factor: No. Bachelors/ Stallions Data 0 Plains zebra bite rate 0.18 - 0.09 - 0.66 12,000 1978 Slope P value 0.00 < 0.40 PC 1:‘Quantity’ PC 2:‘Quality’ PC 3:‘Diversity 700 0 Herd Composition (% B Males) Slope P value Variable 0.09 < .01 Zebra Density 14,000 ZebraNet—a mobile sensor GPS tracking network—is making the invisible, visible. By enabling us to follow zebras at all times of the day, across all seasons, through all diverse habitats and in real time, we will be able to answer basic questions as to whether zebras migrate back and forth over long distances or simply move about nomadically or whether zebras pull predators around or predators push zebras about. Numbers (Lewa) QuickTime™ and a TIFF (LZW) decompressor are needed to see this picture. Grevy's zebra bite rate Variable Zebra Density Numbers (Kenya) Grevy's zebra status in Kenya's Rangelands and on Lewa Wildlife Conservancy: 1978 & 1995-2004 Three selective forces could be involved: the ‘top-down’ force of predation; ‘bottom-up’ forces associated with vegetation abundance, quality or diversity; or socio-sexual forces associated with intruders and cuckoldry pressure. Of these, intruder pressure as measured by the ratio of bachelor males to stallions accounted for most of the Herd Size How do zebras move about landscapes? Dirt Jioni Usiku and all zebras prefer grasslands with a few acacia trees and water holes, although stallions with females prefer water holes less strongly than all male groups. For stallion groups the attraction to water holes is weaker at night then during the day. Most interesting is the fact that harem groups tend to switch from avoiding bushland during the day to preferring it at night. Perhaps the asymmetry in detection might be sufficiently reduced to permit use of these important habitats during the night. 0.2 Grass-Trees 0 Bushland -0.2 Dense Forest -0.4 Water -0.6 Adhuhuri Night -0.8 Day Night Time of Day Challenges remain in order for ZebraNet to function for long periods. But when these are overcome, additional insights will emerge into the lives of zebras and the ways wildlife and livestock interact on a common landscape.


