Choosing a statistical test FACT SHEET Fact sheet: Background to statistics
advertisement

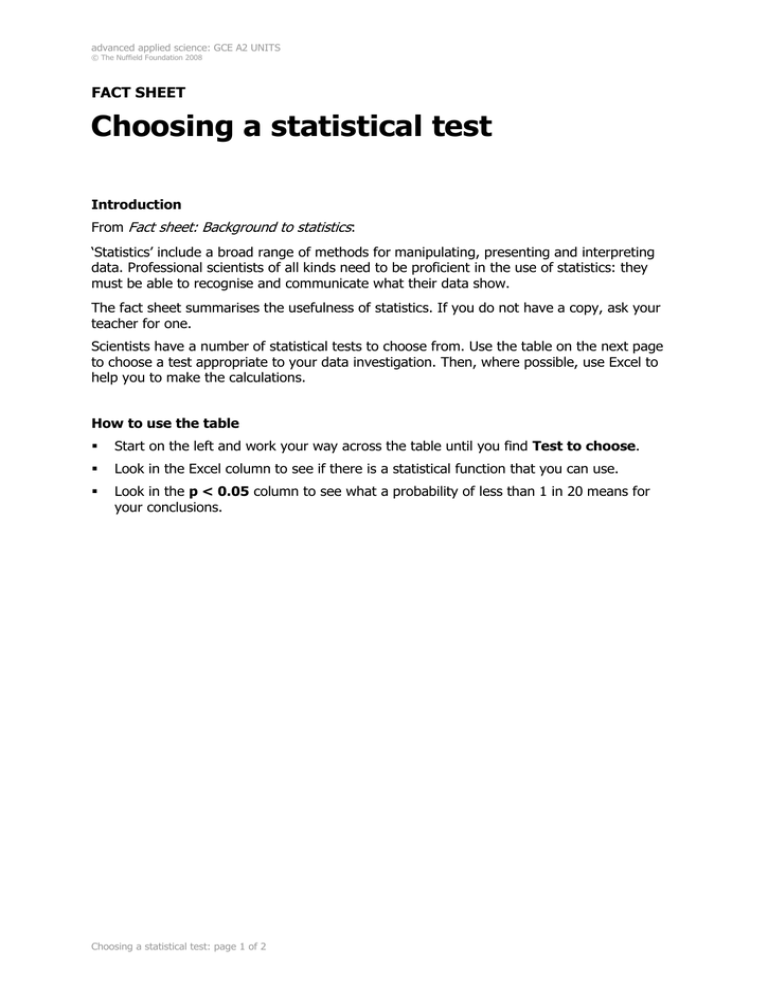
advanced applied science: GCE A2 UNITS © The Nuffield Foundation 2008 FACT SHEET Choosing a statistical test Introduction From Fact sheet: Background to statistics: ‘Statistics’ include a broad range of methods for manipulating, presenting and interpreting data. Professional scientists of all kinds need to be proficient in the use of statistics: they must be able to recognise and communicate what their data show. The fact sheet summarises the usefulness of statistics. If you do not have a copy, ask your teacher for one. Scientists have a number of statistical tests to choose from. Use the table on the next page to choose a test appropriate to your data investigation. Then, where possible, use Excel to help you to make the calculations. How to use the table Start on the left and work your way across the table until you find Test to choose. Look in the Excel column to see if there is a statistical function that you can use. Look in the p < 0.05 column to see what a probability of less than 1 in 20 means for your conclusions. Choosing a statistical test: page 1 of 2 advanced applied science: GCE A2 UNITS © The Nuffield Foundation 2008 Type of data Frequencies (counts of categories) Type of test Test to choose Compares observed and expected values Large samples (>30) Differences between means of normal data (parametric) Measurements (continuous interval scale) 2 sets of data Small (>5) or large samples 2 Standard error of the difference ANOVA Differences between medians of non-normal data (non-parametric) Testing for a relationship Finding how factors are related Choosing a statistical test: page 2 of 2 p < 0.05 Hypothesis predicts numbers =CHITEST() Difference between counts Association No Excel function but can be calculated* reject hypothesis significant difference significant association significant difference *=SQRT((VAR(range 1)/COUNT(range 1))+VAR((range 2)/COUNT(range 2)) Paired data significant difference (type1) t-test =TTEST() Unpaired data significant difference (type2) More than 2 sets of data Testing for correlation Excel Tools>Data analysis>Anova significant difference Mann-Whitney U-test No Excel function significant difference Pearson’s correlation coefficient =PEARSON() Tests for zero correlation significant correlation Spearman’s correlation coefficient Use =PEARSON() on ranked data Tests for zero correlation significant correlation Linear regression Use trendline and Gives slope and intercept (not a probability test) display equation


