1471-2148-12-145-S1.DOC
advertisement
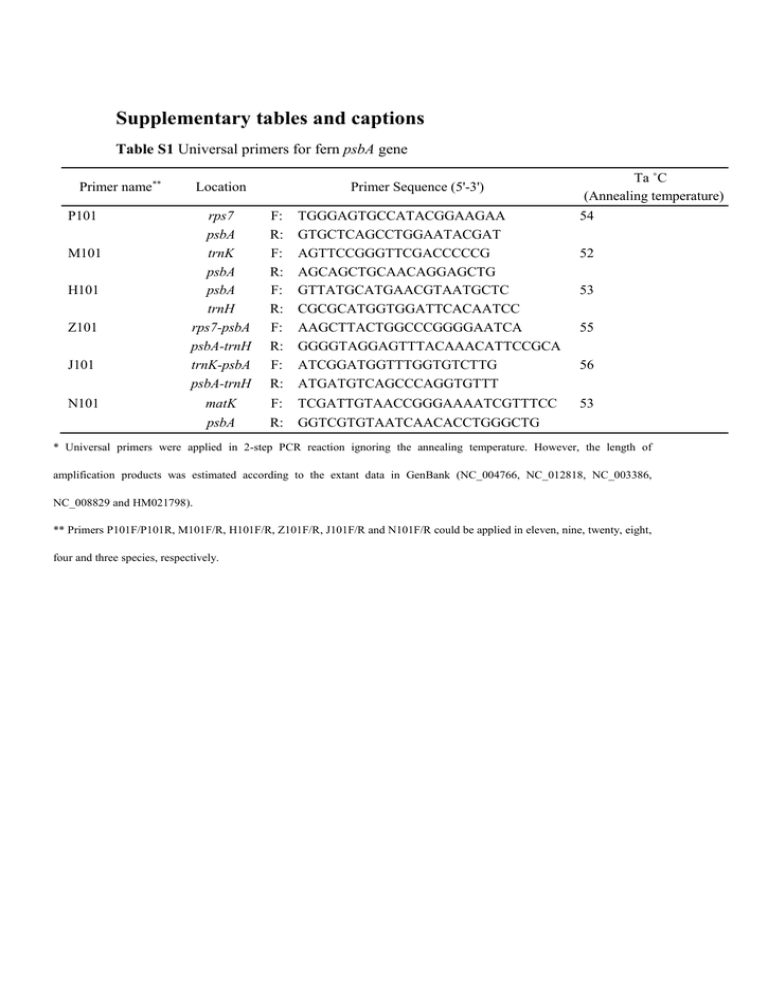
Supplementary tables and captions Table S1 Universal primers for fern psbA gene Primer name** P101 M101 H101 Z101 J101 N101 Location rps7 psbA trnK psbA psbA trnH rps7-psbA psbA-trnH trnK-psbA psbA-trnH matK psbA Primer Sequence (5'-3') F: R: F: R: F: R: F: R: F: R: F: R: TGGGAGTGCCATACGGAAGAA GTGCTCAGCCTGGAATACGAT AGTTCCGGGTTCGACCCCCG AGCAGCTGCAACAGGAGCTG GTTATGCATGAACGTAATGCTC CGCGCATGGTGGATTCACAATCC AAGCTTACTGGCCCGGGGAATCA GGGGTAGGAGTTTACAAACATTCCGCA ATCGGATGGTTTGGTGTCTTG ATGATGTCAGCCCAGGTGTTT TCGATTGTAACCGGGAAAATCGTTTCC GGTCGTGTAATCAACACCTGGGCTG Ta ˚C (Annealing temperature) 54 52 53 55 56 53 * Universal primers were applied in 2-step PCR reaction ignoring the annealing temperature. However, the length of amplification products was estimated according to the extant data in GenBank (NC_004766, NC_012818, NC_003386, NC_008829 and HM021798). ** Primers P101F/P101R, M101F/R, H101F/R, Z101F/R, J101F/R and N101F/R could be applied in eleven, nine, twenty, eight, four and three species, respectively. Table S2 Species-specific primers for psbA gene from eight fern species Species Cyathea lepifera Nephrolepis exaltata Lygodium scandens Dicranopteris linearis Dipteris chinensis Diplopterygium chinensis Vandenboschia radicans Helminthostachys zeylanica Primer Sequence (5'-3') F: R: F: R: F: R: F: R: F: R: F: R: F: R: F: R: TAGCTGGCGTATTCGGCGGC TCCGTTCTACCGCACGAACCT ACATCGTAGCCGCTCACGGC TGCCGCACGAACCTTCATCTCA GGCGTATTCGGCGGCTCTCT CATCGCGTGGAGTCACGGCA AGGCATCTGGTTCACCGCCT CGGGATGTGTTCGAGGTGACACA GCCGCTTGGCCCGTAGTAGG CCACTTGGCTACGTCCGCCC CTGGCGTATTCGGCGGCTCT TGGGGTCATTCAAGCGGTGC TGGCGTATTCGGCGGCTCTC TGGCTACGTCCGCCCTCTCT TGCTACATGGGTCGTGAGTGGGA TCGGAAAGGGCAAGGGATGCA * Annealing temperature (Ta ˚C) was calculated via Primer 3 (http://frodo.wi.mit.edu/primer3/). **Length of the products were verified by the multiply sequencing results. Ta(˚C)* Length** 53 556bp 54 412bp 53 594bp 53 489bp 54 641bp 55 797bp 55 898bp 54 963bp Table S3 Six datasets of different species and fragments No. Species 1 2 3 4 psbA gene in LSC region psbA gene in IR regions All species* psbA gene in LSC region 5 psbA gene in IR regions 6 All species* Fragments Full-length coding region without stop codon** psbA encoding sequence and psbA-trnH intergenic regions*** *Twenty-seven species from Table 1 and Table S4 were included in this dataset 6. **Since it was strictly rejected in the molecular adaptive evolution models, the stop codon was excluded in the encoding region alignments. Specifically, dataset 1, 2 and 3 were utilized in the selective pressure analysis via different models harboured within PAML package, Selecton and Datamonkey websites. ***To obtain a better phylogeny with estimated time-scale, the combined datasets (No. 4, 5 and 6) were applied via BEAST based on a relaxed molecular clock. Consequently, the results were utilized in the analysis of the adaptive evolution respectively as the guide phylogeny structures. Table S4 Species and accession number of the retrieved data Order Family Polypodiales Dennstaedtiaceae Pteridaceae Cyatheales Equisetales Marattiales Psilotales Isoetales Cyatheaceae Equisetaceae Marattiaceae Psilotaceae Isoetaceae Genus Species GenBank Accession Pteridium Cheilanthes Adiantum Alsophila Equisetum Angiopteris Psilotum Isoetes P. aquilinum subsp aquilinum L. C. lindheimeri Hook. A. capillus-veneris L. A. spinulosa (Hook.) R.M.Tryon E. arvense L. A. evecta (Forst.) Hoffm. P. nudum (L.) Beauv. I. flaccida Shuttlw. ex A. Braun NC_014348 NC_014592 NC_004766 NC_012818 GU191334 NC_008829 NC_003386 GU191333 *Though several other partial plastomes of fern species have already been published [13], it is the encoding regions of psbA gene that were not fully obtained. To avoid multiply gaps in alignments, the partial encoding sequence data of D1 protein from those species were excluded from present investigation. Table S5 LRTs of the random-site models in PAML version 4.1* Dataset** Model 2△ℓ p-value α=0.05 α=0.01 One M0/M3 102.82 2.4×10⁻²¹ ● ● M1a/M2a 0 Non-significant ○ ○ M7/M8 15.16 5.1×10⁻⁴ ● ● 15.62 -5 ● ● ● ● M8a/M8 Two Three 9.8×10 -13 M0/M3 66.51 1.24×10 M1a/M2a 0 Non-significant ○ ○ M7/M8 6.17 0.0472 ● ○ M8a/M8 6.14 0.0135 ● ○ ● ● -44 M0/M3 208.58 5.37×10 M1a/M2a 0 Non-significant ○ ○ 5.6×10 -4 ● ● 1.1×10 -4 ● ● M7/M8 M8a/M8 14.96 14.82 *●Stands for significant result and ○ for non-significant. **The contexts of the datasets were introduced in Supplementary Table 3. Table S6 Positively selected codons determined via REL model Positively selected codon Dataset One Two Three *PP>95% dS dN Posterior Possibility No. Position 1 4* 0.1769 0.4208 97.05% 2 155* 0.2002 0.4278 96.79% 1 53 0.2693 0.7535 93.57% 2 155 0.2685 0.7559 93.94% 3 348 0.6304 0.7559 62.95% 4 350 0.2852 0.7559 92.51% 5 351 0.5726 0.7559 67.90% 6 352 0.2778 0.7559 93.15% 1 4* 0.3459 0.4641 98.88% 2 53 0.4428 0.4640 91.27% 3 155 0.4415 0.4641 91.38% 4 346 0.5787 0.4589 79.73% 5 348 0.3915 0.4560 93.63% 6 349 0.4931 0.4602 86.68% 7 350 0.5152 0.4640 85.60% 8 352 0.5181 0.4640 85.36%
