CLU January 22, 2008 Faculty Workshop Online Student Evaluation System
advertisement
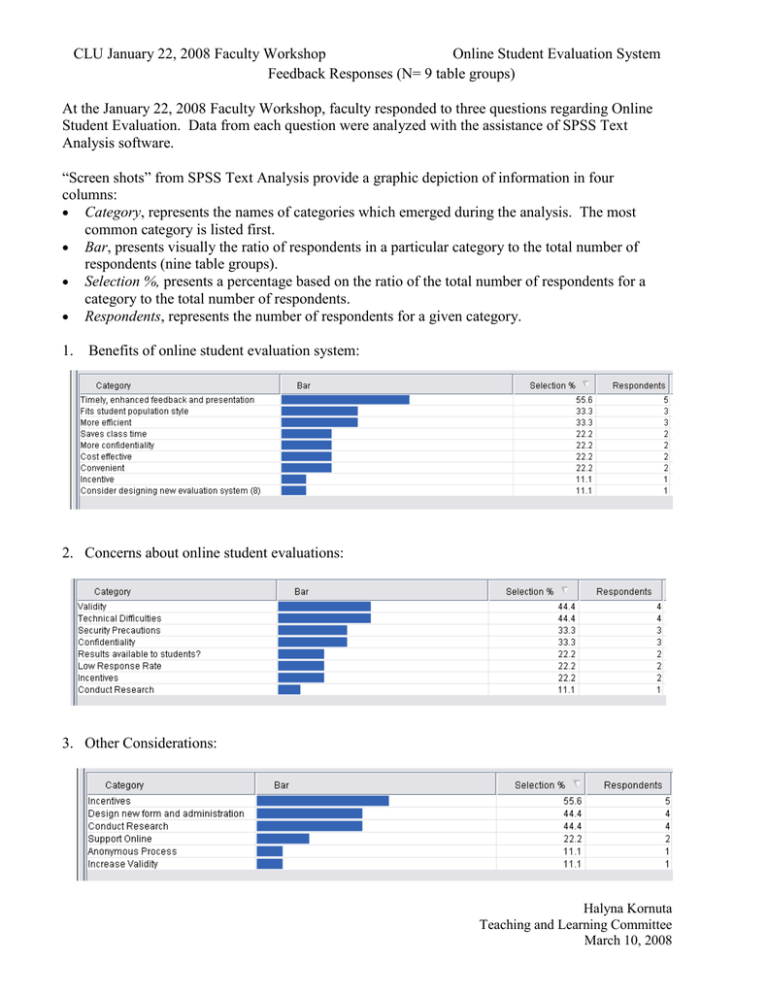
CLU January 22, 2008 Faculty Workshop Online Student Evaluation System Feedback Responses (N= 9 table groups) At the January 22, 2008 Faculty Workshop, faculty responded to three questions regarding Online Student Evaluation. Data from each question were analyzed with the assistance of SPSS Text Analysis software. “Screen shots” from SPSS Text Analysis provide a graphic depiction of information in four columns: Category, represents the names of categories which emerged during the analysis. The most common category is listed first. Bar, presents visually the ratio of respondents in a particular category to the total number of respondents (nine table groups). Selection %, presents a percentage based on the ratio of the total number of respondents for a category to the total number of respondents. Respondents, represents the number of respondents for a given category. 1. Benefits of online student evaluation system: 2. Concerns about online student evaluations: 3. Other Considerations: Halyna Kornuta Teaching and Learning Committee March 10, 2008
