Wks 3 Excel Project for Chapters 1 and 2.docx
advertisement
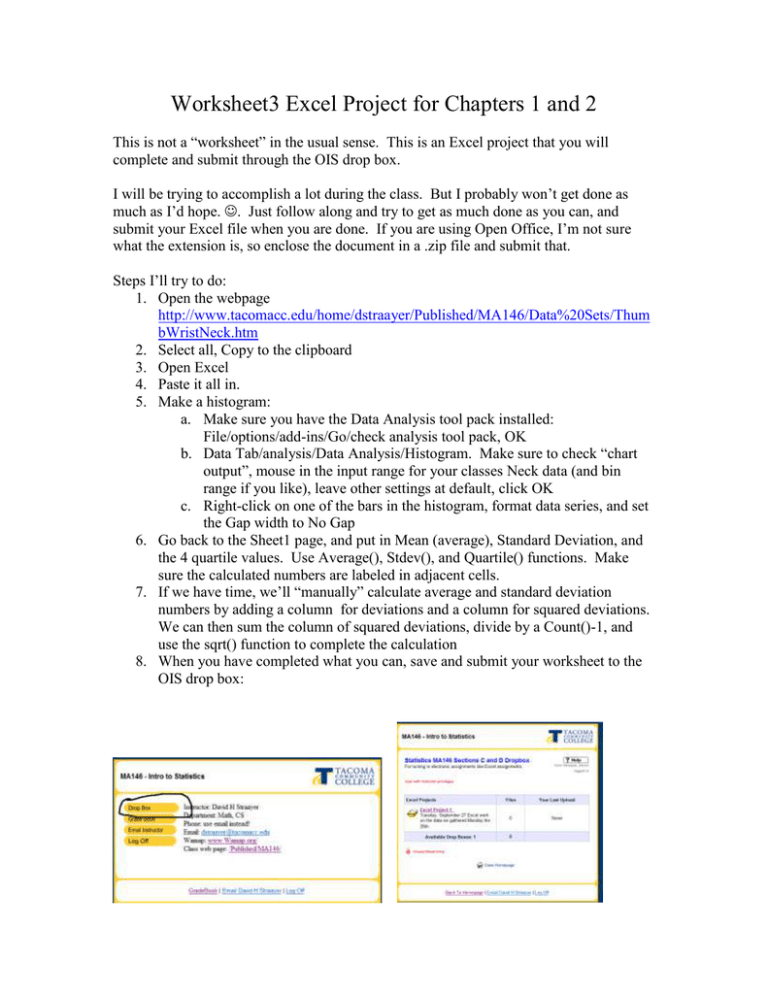
Worksheet3 Excel Project for Chapters 1 and 2 This is not a “worksheet” in the usual sense. This is an Excel project that you will complete and submit through the OIS drop box. I will be trying to accomplish a lot during the class. But I probably won’t get done as much as I’d hope. . Just follow along and try to get as much done as you can, and submit your Excel file when you are done. If you are using Open Office, I’m not sure what the extension is, so enclose the document in a .zip file and submit that. Steps I’ll try to do: 1. Open the webpage http://www.tacomacc.edu/home/dstraayer/Published/MA146/Data%20Sets/Thum bWristNeck.htm 2. Select all, Copy to the clipboard 3. Open Excel 4. Paste it all in. 5. Make a histogram: a. Make sure you have the Data Analysis tool pack installed: File/options/add-ins/Go/check analysis tool pack, OK b. Data Tab/analysis/Data Analysis/Histogram. Make sure to check “chart output”, mouse in the input range for your classes Neck data (and bin range if you like), leave other settings at default, click OK c. Right-click on one of the bars in the histogram, format data series, and set the Gap width to No Gap 6. Go back to the Sheet1 page, and put in Mean (average), Standard Deviation, and the 4 quartile values. Use Average(), Stdev(), and Quartile() functions. Make sure the calculated numbers are labeled in adjacent cells. 7. If we have time, we’ll “manually” calculate average and standard deviation numbers by adding a column for deviations and a column for squared deviations. We can then sum the column of squared deviations, divide by a Count()-1, and use the sqrt() function to complete the calculation 8. When you have completed what you can, save and submit your worksheet to the OIS drop box:
