Handoutn 14 Randomized Block Design.doc
advertisement
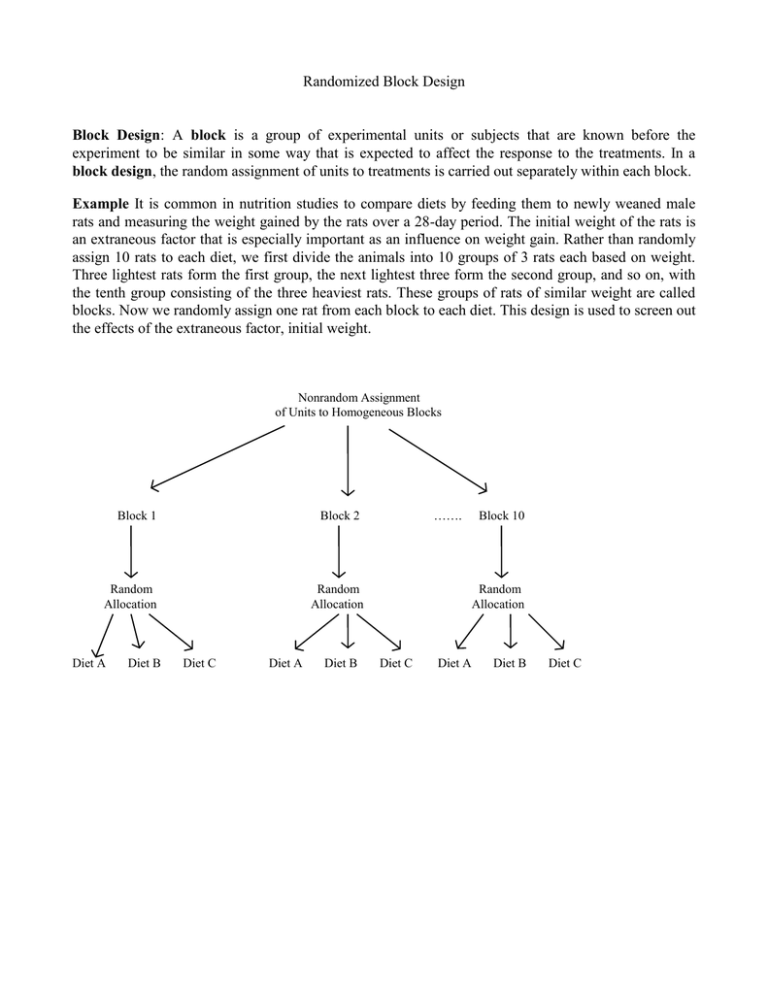
Randomized Block Design Block Design: A block is a group of experimental units or subjects that are known before the experiment to be similar in some way that is expected to affect the response to the treatments. In a block design, the random assignment of units to treatments is carried out separately within each block. Example It is common in nutrition studies to compare diets by feeding them to newly weaned male rats and measuring the weight gained by the rats over a 28-day period. The initial weight of the rats is an extraneous factor that is especially important as an influence on weight gain. Rather than randomly assign 10 rats to each diet, we first divide the animals into 10 groups of 3 rats each based on weight. Three lightest rats form the first group, the next lightest three form the second group, and so on, with the tenth group consisting of the three heaviest rats. These groups of rats of similar weight are called blocks. Now we randomly assign one rat from each block to each diet. This design is used to screen out the effects of the extraneous factor, initial weight. Nonrandom Assignment of Units to Homogeneous Blocks Block 1 Random Allocation Diet A Diet B ……. Block 2 Random Allocation Diet C Diet A Diet B Block 10 Random Allocation Diet C Diet A Diet B Diet C Example An accounting firm, prior to introducing in the firm widespread training in statistical sampling for auditing, tested three training methods: (1) study at home with programmed training materials, (2) training sessions at local offices conducted by local staff, (3) training session in Chicago conducted by national staff.Thirty auditors were grouped into 10 blocks of three, according to time elasped since college graduation, and the auditors in each block were randomly assigned to the three training methods. At the end of the training, each auditor was asked to analyze a complex case involving statistical applications: a proficiency measure based on this analysis was obtained for each auditor. The results were (block 1 consists of auditors graduated most recently, block 10 consists of those graduated most distantly): Block 1 2 3 4 5 6 7 8 9 10 Training Method 2 81 78 76 77 71 75 72 74 73 69 1 73 76 75 74 76 73 68 64 65 62 3 92 89 87 90 88 86 88 82 81 78 Normal Probability Plot (response is score) 99 95 90 Percent 80 70 60 50 40 30 20 10 5 1 -5.0 -2.5 0.0 Residual 2.5 5.0 Versus Fits (response is score) 5.0 Residual 2.5 0.0 -2.5 -5.0 60 65 70 75 80 Fitted Value 85 90 Source Method Block Error Total DF 2 9 18 29 Seq SS 1295.00 433.37 112.33 1840.70 Adj SS 1295.00 433.37 112.33 Adj MS 647.50 48.15 6.24 F 103.75 7.72 P 0.000 0.000 Tukey 95.0% Simultaneous Confidence Intervals Response Variable score All Pairwise Comparisons among Levels of method method = 1 subtracted from: method 2 3 Lower 1.148 12.648 method = 2 method 3 Center 4.000 15.500 Upper 6.852 18.352 --------+---------+---------+-------(-----*-----) (-----*-----) --------+---------+---------+-------5.0 10.0 15.0 subtracted from: Lower 8.648 Center 11.50 Upper 14.35 --------+---------+---------+-------(-----*-----) --------+---------+---------+-------5.0 10.0 15.0 Tukey Simultaneous Tests Response Variable score All Pairwise Comparisons among Levels of method method = 1 subtracted from: method 2 3 Difference of Means 4.000 15.500 method = 2 method 3 SE of Difference 1.117 1.117 T-Value 3.580 13.874 Adjusted P-Value 0.0058 0.0000 T-Value 10.29 Adjusted P-Value 0.0000 subtracted from: Difference of Means 11.50 SE of Difference 1.117

