StatLab1_Soln.doc
advertisement

EY680
SOLUTIONS: Birth-and-Death Processes
March 21, 2006
Task 1. Poisson process. Nothing to do here but run the code.
Task 2. Yule-Furry process. Easy modification of the Poisson process code: need to
change the birth parameter to lambda*X[i-1] and also change the analytic mean function,
M.
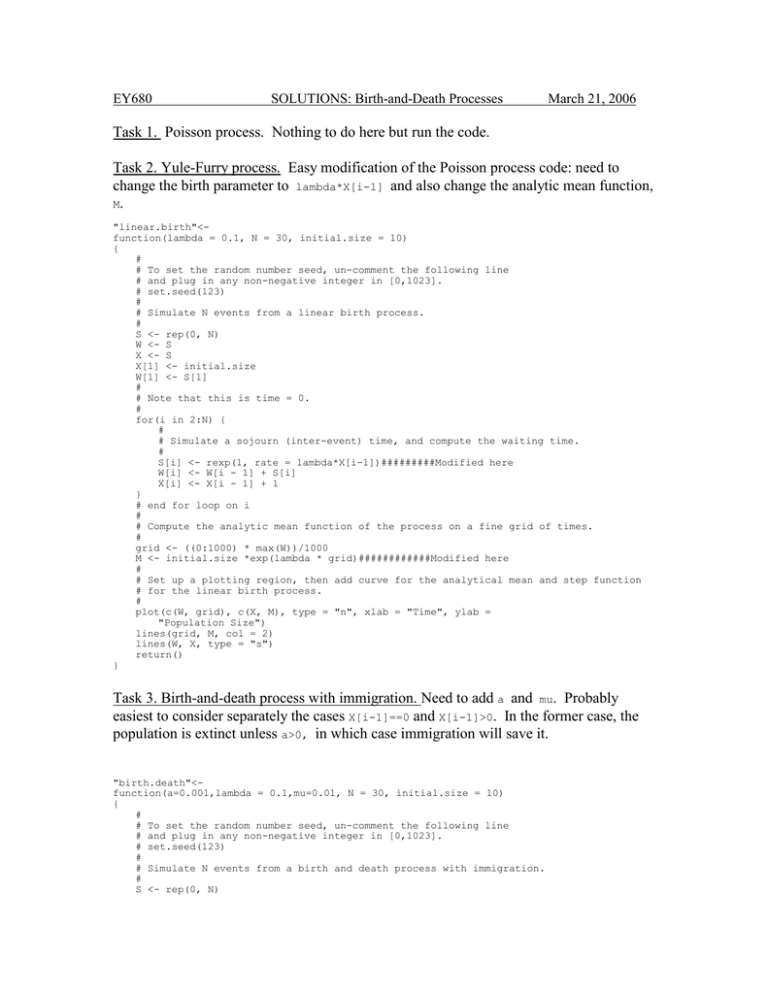
"linear.birth"<function(lambda = 0.1, N = 30, initial.size = 10)
{
#
# To set the random number seed, un-comment the following line
# and plug in any non-negative integer in [0,1023].
# set.seed(123)
#
# Simulate N events from a linear birth process.
#
S <- rep(0, N)
W <- S
X <- S
X[1] <- initial.size
W[1] <- S[1]
#
# Note that this is time = 0.
#
for(i in 2:N) {
#
# Simulate a sojourn (inter-event) time, and compute the waiting time.
#
S[i] <- rexp(1, rate = lambda*X[i-1])#########Modified here
W[i] <- W[i - 1] + S[i]
X[i] <- X[i - 1] + 1
}
# end for loop on i
#
# Compute the analytic mean function of the process on a fine grid of times.
#
grid <- ((0:1000) * max(W))/1000
M <- initial.size *exp(lambda * grid)############Modified here
#
# Set up a plotting region, then add curve for the analytical mean and step function
# for the linear birth process.
#
plot(c(W, grid), c(X, M), type = "n", xlab = "Time", ylab =
"Population Size")
lines(grid, M, col = 2)
lines(W, X, type = "s")
return()
}
Task 3. Birth-and-death process with immigration. Need to add a and mu. Probably
easiest to consider separately the cases X[i-1]==0 and X[i-1]>0. In the former case, the
population is extinct unless a>0, in which case immigration will save it.
"birth.death"<function(a=0.001,lambda = 0.1,mu=0.01, N = 30, initial.size = 10)
{
#
# To set the random number seed, un-comment the following line
# and plug in any non-negative integer in [0,1023].
# set.seed(123)
#
# Simulate N events from a birth and death process with immigration.
#
S <- rep(0, N)
W <- S
X <- S
X[1] <- initial.size
W[1] <- S[1]
#
# Note that this is time = 0.
#
for(i in 2:N) {
if(X[i-1]==0){
if(a>0){# population is saved by immigration
S[i] <- rexp(1,rate=a)
W[i] <- W[i-1]+1
X[i] <- X[i-1]+1
}
else{
S[i] <- 0
W[i] <- W[i-1]
X[i] <- X[i-1]
}
}
else{
#
# Simulate a sojourn (inter-event) time, and compute the waiting time.
#
overall <- a+lambda*X[i-1]+mu*X[i-1]
S[i] <- rexp(1, rate = overall)
W[i] <- W[i - 1] + S[i]
u <- runif(1)
if(u<mu*X[i-1]/overall){#event is a death
X[i] <- X[i - 1] – 1
}
else{#event is a birth
X[i] <- X[i-1]+1
}
}# end else X>0
}
# end for loop on i
#
# Compute the analytic mean function of the process on a fine grid of times.
#
grid <- ((0:1000) * max(W))/1000
if(((lambda-mu)>0) | ((lambda-mu)<0)){
M <- (initial.size+a/(lambda-mu)) *exp((lambda-mu) * grid)-a/(lambda-mu)
}
else{M <- a*grid+initial.size}
#
# Set up a plotting region, then add curve for the analytical mean and step function
# for the linear birth process.
#
plot(c(W, grid), c(X, M), type = "n", xlab = "Time", ylab =
"Population Size")
lines(grid, M, col = 2)
lines(W, X, type = "s")
return()
}
Task 4. Sterile male insect control. Use the previous code with a=0 and add the number
of sterile males and the carrying capacity. Only modification is to the non-extinct case: if
population is at carrying capacity, only death can occur; if population is below carrying
capacity, birth rate is modified by multiplying by probability of fertile mating.
"sterile.male"<function(a = 0.00, lambda = 4, mu = 1, N = 100, initial.size = 20,sterile=100,K=100)
{
#
# To set the random number seed, un-comment the following line
# and plug in any non-negative integer in [0,1023].
# set.seed(123)
#
#
S <- rep(0, N)
W <- S
X <- S
X[1] <- initial.size
W[1] <- S[1]
#
# Note that this is time = 0.
#
for(i in 2:N) {
if(X[i - 1] == 0) {
if(a > 0) {
# population is saved by immigration
S[i] <- rexp(1, rate = a)
W[i] <- W[i - 1] + 1
X[i] <- X[i - 1] + 1
}
else {
S[i] <- 0
W[i] <- W[i - 1]
X[i] <- X[i - 1]
}
}
else {
if(X[i-1]<K){
#
# Simulate a sojourn (inter-event) time, and compute the waiting time.
#
overall <- a + lambda * X[i - 1]*X[i-1]/(X[i-1]+sterile) + mu * X[i - 1]
S[i] <- rexp(1, rate = overall)
W[i] <- W[i - 1] + S[i]
u <- runif(1)
if(u < (mu * X[i - 1])/overall) {
#event is a death
X[i] <- X[i - 1] - 1
}
else {
#event is a birth
X[i] <- X[i - 1] + 1
}
}#end if X[i-1]<K
else{#population at carrying capacity: event is a death
S[i] <- rexp(1,rate=mu*X[i-1])
W[i] <- W[i-1]+S[i]
X[i] <- X[i-1]-1
}
}# end else
}
# end for loop on i
#
#
plot(W, X, type = "n", xlab = "Time", ylab =
"Population Size")
lines(W, X, type = "s")
return()
}


