Supplemental Table 1. Effect of ... induced. TriTrypDB numbers, log2(fold_change), p ... each transcript are shown. Transcripts are ...
advertisement

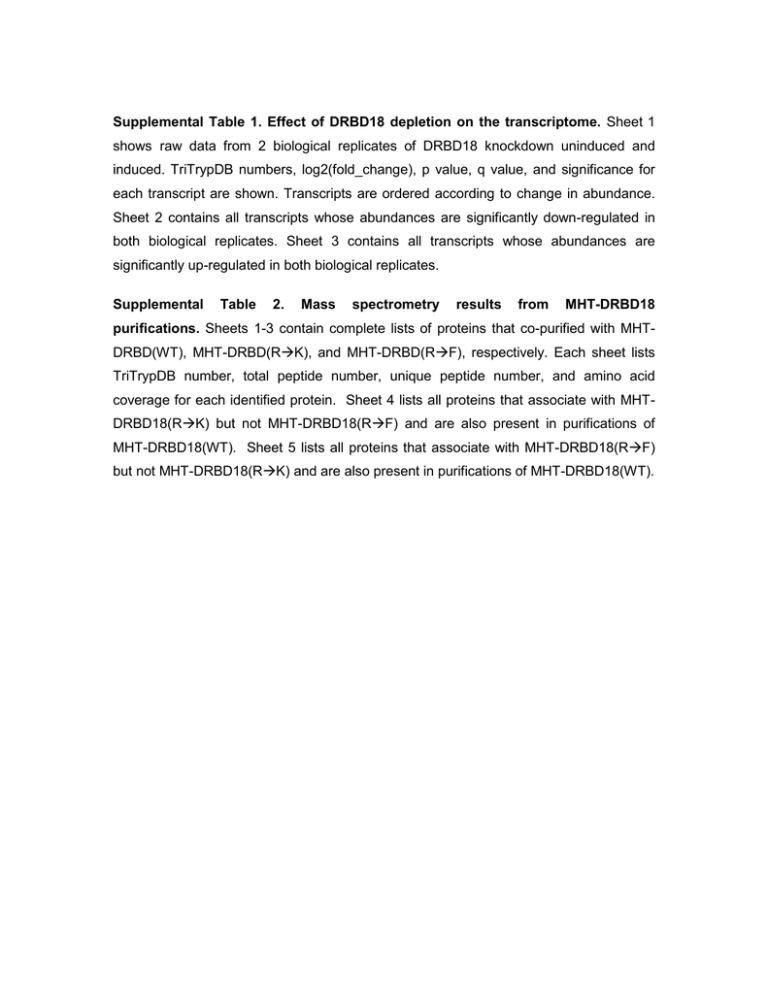
Supplemental Table 1. Effect of DRBD18 depletion on the transcriptome. Sheet 1 shows raw data from 2 biological replicates of DRBD18 knockdown uninduced and induced. TriTrypDB numbers, log2(fold_change), p value, q value, and significance for each transcript are shown. Transcripts are ordered according to change in abundance. Sheet 2 contains all transcripts whose abundances are significantly down-regulated in both biological replicates. Sheet 3 contains all transcripts whose abundances are significantly up-regulated in both biological replicates. Supplemental Table 2. Mass spectrometry results from MHT-DRBD18 purifications. Sheets 1-3 contain complete lists of proteins that co-purified with MHTDRBD(WT), MHT-DRBD(RK), and MHT-DRBD(RF), respectively. Each sheet lists TriTrypDB number, total peptide number, unique peptide number, and amino acid coverage for each identified protein. Sheet 4 lists all proteins that associate with MHTDRBD18(RK) but not MHT-DRBD18(RF) and are also present in purifications of MHT-DRBD18(WT). Sheet 5 lists all proteins that associate with MHT-DRBD18(RF) but not MHT-DRBD18(RK) and are also present in purifications of MHT-DRBD18(WT).

