Tables, Graphs, Conclusions

Name/#___________________________
ALL ABOUT: Data tables, Graphs, Results, and Conclusions
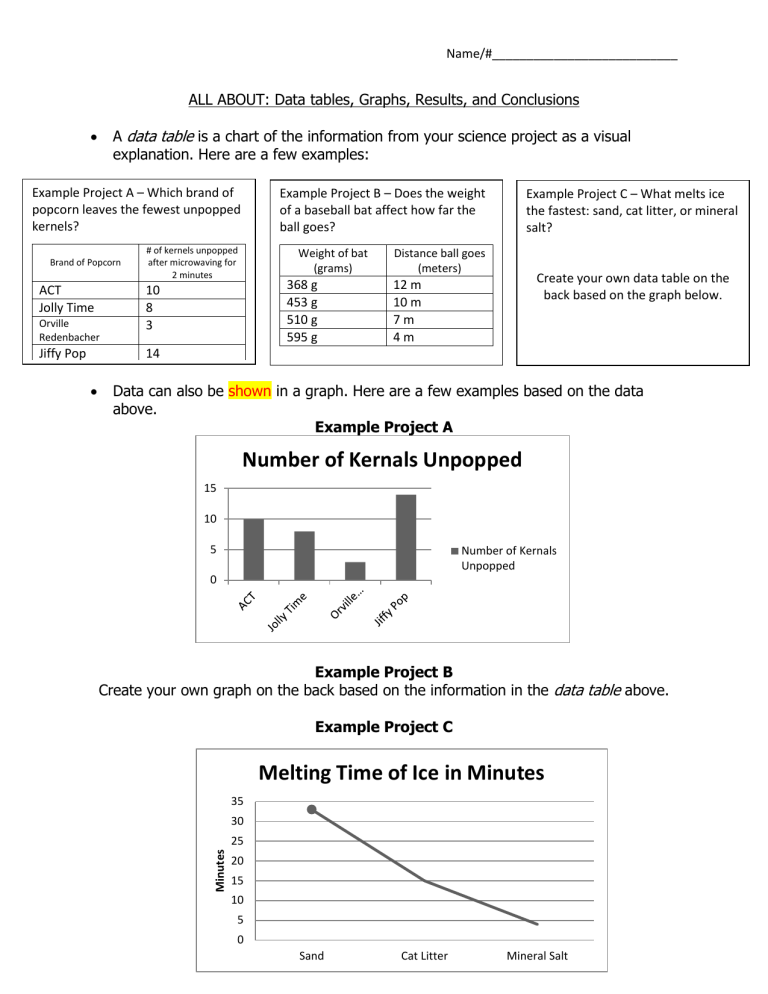
A data table is a chart of the information from your science project as a visual explanation. Here are a few examples:
Example Project A – Which brand of Example Project B – Does the weight Example Project C – What melts ice popcorn leaves the fewest unpopped kernels?
Brand of Popcorn
# of kernels unpopped after microwaving for of a baseball bat affect how far the ball goes?
Weight of bat
(grams)
Distance ball goes
(meters) the fastest: sand, cat litter, or mineral salt?
ACT
Jolly Time
Orville
Redenbacher
Jiffy Pop
10
8
3
14
2 minutes
368 g
453 g
510 g
595 g
12 m
10 m
7 m
4 m
Create your own data table on the back based on the graph below.
Data can also be shown in a graph. Here are a few examples based on the data above.
Example Project A
Number of Kernals Unpopped
15
10
5
0
Number of Kernals
Unpopped
Example Project B
Create your own graph on the back based on the information in the data table above.
Example Project C
Melting Time of Ice in Minutes
35
30
25
20
15
10
5
0
Sand Cat Litter Mineral Salt
Name/#___________________________
1.
Create a data table for Example Project C based on the graph on the front.
Product Melting time in minutes
2.
Create a graph for Example Project B based on the information in the data table.
14
12
10
8
6
4
2
0
368 g
Distance ball goes in meters
453 g
Bat Weight
510 g 595 g
Name/#___________________________
Data tables and graphs are the results of your experiment. You need to have a visual representation to show about your project.
Conclusion is a written documentation of what happened. In your conclusion you will state: o If your hypothesis was accepted or rejected. o The answer to your original problem question. o Why do you think your project turned out the way it did? o If you did this experiment again, what would you do differently?
Example A Conclusion
(You will do this on your own)
Example B Conclusion
My hypothesis was that the lighter weight bat would hit the ball the farthest in all of the bats being tested. My results do support my hypothesis.
The answer to my original question is that the weight of a baseball bat does affect the distance a ball goes.
I think the tests I did went smoothly and I had no problems, except for the fact that the even though there was light wind, it could have played a factor in my results.
Therefore, I had to take the measurements quickly.
An interesting future study might involve testing the distance a baseball goes when hit with a wooden and an aluminum baseball bat.
Example C Conclusion
My hypothesis was that the sand would melt the ice the fastest. My results reject my hypothesis.
The answer to my original question is that the sand substance melts ice the slowest , as compared to mineral salt and cat litter.
I think the tests I did went smoothly and I had no problems. If I were to do the experiment again, I would use a larger amount of ice next time and test 5 substances instead of 3.
An interesting future study might involve if the amount of sand affects the time it takes for ice to melt.
Go to back
Name/#___________________________
3.
Pretend you were going to do Project A. Create your own conclusion for the experiment. Use your imagination!
Remember all you really need is 4 sentences to answer the 4 bullet points for a conclusion!


