Fall 2013 - Exam 2
advertisement
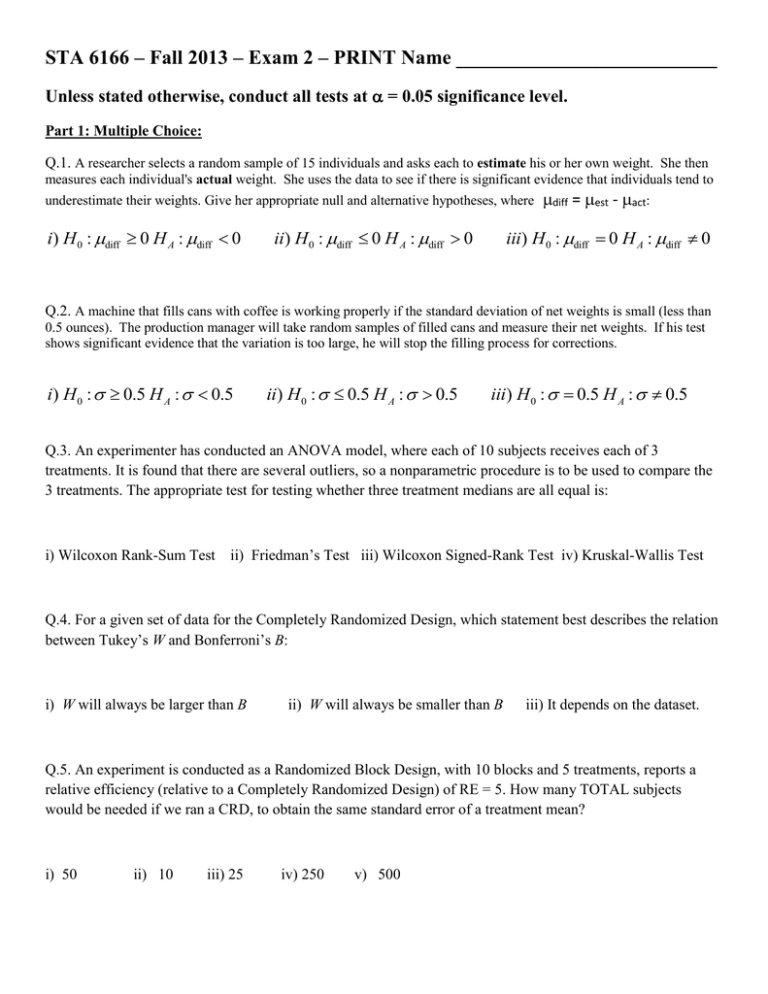
STA 6166 – Fall 2013 – Exam 2 – PRINT Name __________________________ Unless stated otherwise, conduct all tests at = 0.05 significance level. Part 1: Multiple Choice: Q.1. A researcher selects a random sample of 15 individuals and asks each to estimate his or her own weight. She then measures each individual's actual weight. She uses the data to see if there is significant evidence that individuals tend to underestimate their weights. Give her appropriate null and alternative hypotheses, where i) H 0 : diff 0 H A : diff 0 ii) H 0 : diff 0 H A : diff 0 diff = est - act: iii) H 0 : diff 0 H A : diff 0 Q.2. A machine that fills cans with coffee is working properly if the standard deviation of net weights is small (less than 0.5 ounces). The production manager will take random samples of filled cans and measure their net weights. If his test shows significant evidence that the variation is too large, he will stop the filling process for corrections. i) H 0 : 0.5 H A : 0.5 ii) H 0 : 0.5 H A : 0.5 iii) H 0 : 0.5 H A : 0.5 Q.3. An experimenter has conducted an ANOVA model, where each of 10 subjects receives each of 3 treatments. It is found that there are several outliers, so a nonparametric procedure is to be used to compare the 3 treatments. The appropriate test for testing whether three treatment medians are all equal is: i) Wilcoxon Rank-Sum Test ii) Friedman’s Test iii) Wilcoxon Signed-Rank Test iv) Kruskal-Wallis Test Q.4. For a given set of data for the Completely Randomized Design, which statement best describes the relation between Tukey’s W and Bonferroni’s B: i) W will always be larger than B ii) W will always be smaller than B iii) It depends on the dataset. Q.5. An experiment is conducted as a Randomized Block Design, with 10 blocks and 5 treatments, reports a relative efficiency (relative to a Completely Randomized Design) of RE = 5. How many TOTAL subjects would be needed if we ran a CRD, to obtain the same standard error of a treatment mean? i) 50 ii) 10 iii) 25 iv) 250 v) 500 Part 2: Problems: Q.6. An automobile rental company is interested in comparing the mean highway mileages among 3 models of cars. They sample 10 cars of each model, and measure the mileage on each car (Y, in miles per gallon), based on a highway drive of a fixed distance. The results (mean and standard deviation) are given below. Complete the Analysis of Variance table. Model 1 2 3 Mean 17.0 23.0 20.0 SD 5.0 6.0 4.0 ANOVA Source Treatments Error Total df SS MS F_obs F(.05) Q.7. A study was conducted in n=30 subjects to determine the effect of an ultrasound treatment for carpal tunnel syndrome. Each subject received an active ultrasound on one wrist, and a sham ultrasound (placebo) on their other wrist. The following table gives the mean and standard deviation of the response: change in hand grip strength during the study, for each treatment, and for the difference within subjects. Mean Active Placebo Difference 3.87 -0.09 3.96 SD 5.16 5.56 5.59 p.7.a. Compute a 95% Confidence Interval for A - P. p.7.b. From this Interval, the P-value for test H0: A - P = 0 vs HA: A - P ≠ 0 is < or > 0.05? Q.8. A study was conducted to determine how consistent forensic examiners (“treatments”) are when determining the number of minutiae that appear on latent fingerprints (“blocks”). The study involve t = 10 examiners and b = 10 latent fingerprints. Each fingerprint was observed by each examiner. The means are given below, as well as some summary statistics. Means Fingerprint Examiner Y 12.7 1 20.6 10.2 2 13.4 11.3 Y 10 10 i 1 j 1 10 (20.6 12.7) 2 ij Y 3 20.1 11.8 2 4 9.8 13.5 5 10.7 11.3 6 8.4 12.9 7 12.1 13.6 8 15.6 11.3 9 7.1 17.4 3359 (9.1 12.7) 2 2016 10 (10.2 12.7) 2 (13.6 12.7) 2 373 p.8.a. Complete the following ANOVA table. Source df 10 9.1 13.6 SS MS F p.8.b. Compute Bonferroni’s Minimum significant difference for comparing all pairs of examiners. Q.9. A 1-Way ANOVA model is fit comparing the weights of 4 natural fiber fabrics of common dimensions. There were 15 replicates for each of the 4 fibers (cotton, linen, silk, and wool). The sample means and error sum of squares are given below. Compute Tukey’s Honest Significant Difference (W), and identify which fibers differ significantly. Y C 14.9 Y L 18.9 Y S 9.9 Y W 20.1 SSE 727 Q.10. Two types of measuring instruments may be used to determine a measurement that is critical in a laboratory analysis. Each instrument is used to make measurements of a known substance. Do the sample results indicate there is a difference in the precision (variability) of the measurements for the two instruments? Intrument1 n Mean SD 8 8.2 1.24 Intrument2 8 8.1 0.64
