item3 AttachE
advertisement

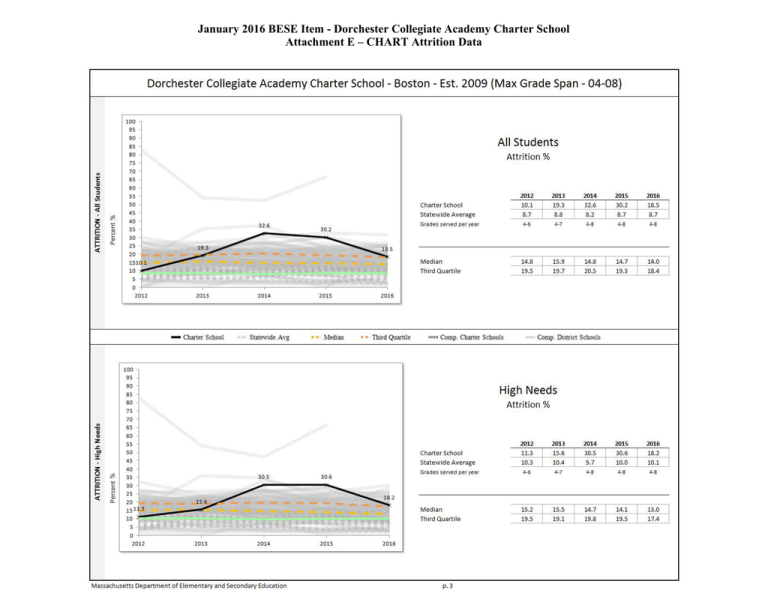
January 2016 BESE Item - Dorchester Collegiate Academy Charter School Attachment E – CHART Attrition Data January 2016 BESE Item - Dorchester Collegiate Academy Charter School Attachment E – CHART Attrition Data January 2016 BESE Item - Dorchester Collegiate Academy Charter School Attachment E – CHART Attrition Data January 2016 BESE Item - Dorchester Collegiate Academy Charter School Attachment E – CHART Attrition Data Grade by Grade Attrition for 2013-2014 (students who were enrolled in June 2013 but not in fall 2013): Student Group 4 5 6 7 All All Students 25.7 27.3 53.1 25.0 32.6 Female 27.8 27.8 53.8 28.6 33.3 Male 23.5 26.7 52.6 22.2 31.9 High needs 15.0 21.4 53.6 27.6 30.5 Low income 0.0 24.0 56.0 29.6 31.5 Students w/disabilities 28.6 28.6 29.2 Afr. Amer./Black 34.6 32.0 52.0 20.0 35.4 Asian Hispanic/Latino 16.7 36.4 25.0 Grade by Grade Attrition for 2014-2015 (students who were enrolled in June 2014 but not in fall 2014): Student Group 4 5 6 7 All All Students 33.3 38.9 31.4 17.9 30.2 Female 26.7 44.4 31.6 18.2 29.7 Male 37.5 33.3 31.3 17.6 30.7 High needs 33.3 37.1 33.3 18.9 30.6 ELL 15.4 30.0 28.6 21.9 Low income 33.3 37.1 31.3 18.9 30.1 Students w/disabilities 80.0 28.6 28.6 25.0 43.8 Afr. Amer./Black 35.5 33.3 34.6 14.8 29.5 Asian Hispanic/Latino 16.7 45.5 16.7 28.6 30.0 January 2016 BESE Item - Dorchester Collegiate Academy Charter School Attachment E – CHART Attrition Data Grade by Grade Attrition for 2015-2016 (students who were enrolled in June 2015 but not in fall 2015) Student Group 4 5 6 7 All 12.5 22.5 10.7 26.3 18.5 All Students 0 20 10 21.1 13.3 Female 20.8 24 11.1 31.6 22.1 Male 15.2 22.6 10 23.1 18.2 High needs Economically 18.5 27.8 0 18.2 18.7 Disadvantaged 28.6 12.5 33.3 19.2 ELL 11.1 0 8.3 6.7 Students w/disabilities 15.4 20 5.3 30 19 Afr. Amer./Black Asian 7.7 22.2 14.3 16.7 14.3 Hispanic/Latino Additional Information: Please note that the subgroup data in this attachment are based on Oct. 1 certified SIMS data.


