4/14/07 Update
advertisement

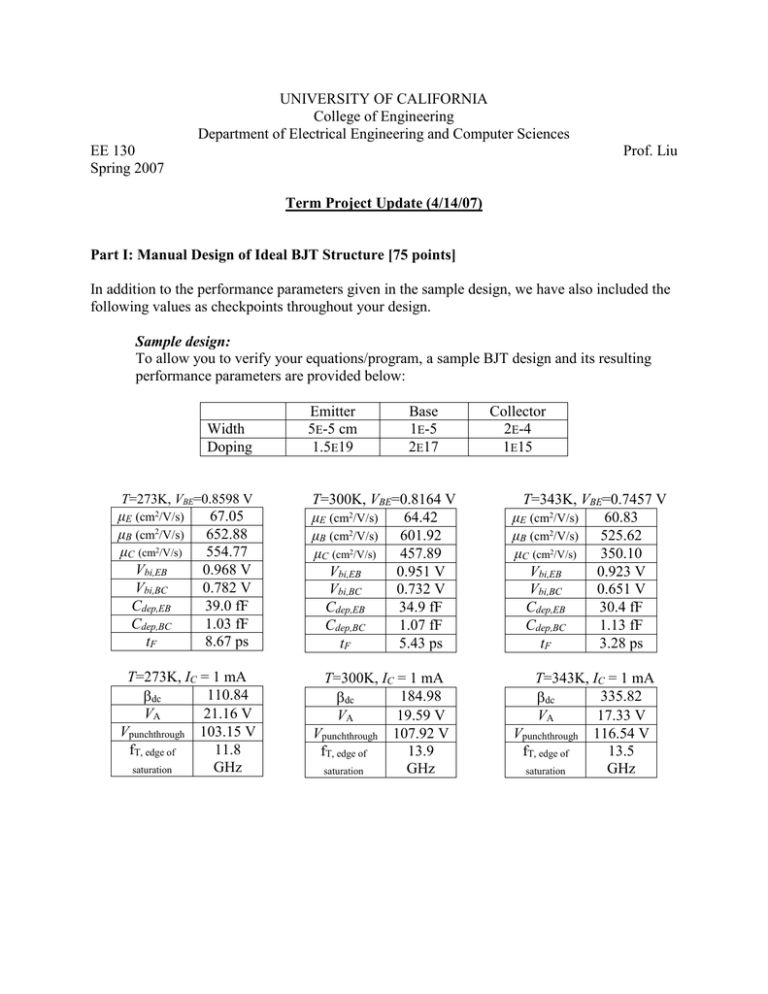
UNIVERSITY OF CALIFORNIA College of Engineering Department of Electrical Engineering and Computer Sciences EE 130 Spring 2007 Prof. Liu Term Project Update (4/14/07) Part I: Manual Design of Ideal BJT Structure [75 points] In addition to the performance parameters given in the sample design, we have also included the following values as checkpoints throughout your design. Sample design: To allow you to verify your equations/program, a sample BJT design and its resulting performance parameters are provided below: Width Doping T=273K, VBE=0.8598 V μE (cm2/V/s) μB (cm2/V/s) μC (cm2/V/s) Vbi,EB Vbi,BC Cdep,EB Cdep,BC tF 67.05 652.88 554.77 0.968 V 0.782 V 39.0 fF 1.03 fF 8.67 ps T=273K, IC = 1 mA 110.84 dc VA 21.16 V Vpunchthrough 103.15 V fT, edge of 11.8 GHz saturation Emitter 5E-5 cm 1.5E19 Base 1E-5 2E17 Collector 2E-4 1E15 T=300K, VBE=0.8164 V μE (cm2/V/s) 64.42 μB (cm2/V/s) 601.92 μC (cm2/V/s) 457.89 Vbi,EB 0.951 V Vbi,BC 0.732 V Cdep,EB 34.9 fF Cdep,BC 1.07 fF tF 5.43 ps T=343K, VBE=0.7457 V μE (cm2/V/s) 60.83 μB (cm2/V/s) 525.62 μC (cm2/V/s) 350.10 Vbi,EB 0.923 V Vbi,BC 0.651 V Cdep,EB 30.4 fF Cdep,BC 1.13 fF tF 3.28 ps T=300K, IC = 1 mA 184.98 dc VA 19.59 V Vpunchthrough 107.92 V fT, edge of 13.9 GHz saturation T=343K, IC = 1 mA 335.82 dc VA 17.33 V Vpunchthrough 116.54 V fT, edge of 13.5 GHz saturation Part II: Computer Simulation of a More Realistic BJT Structure [25 points] Add a statement to generate an IC vs. VCE plot for multiple values of IB: 10 A, 20 A, 30 A, 40 A and 50 A. To plot the output characteristics, assume that IB only depends on VBE. We are providing the MEDICI code that allows you to generate a family of curves for the IC vs. VCE plot. At the end of your input file (Line 107) add the following lines of code: COMMENT COMMENT SOLVE LOG SOLVE LOG Generate Ic vs Vce characteristics Solve Ic for Ib=10uA V(Base)=[Value of VBE that corresponds to IB=10uA] V(Collector)=0.1 OUT.FILE=Ib10uA V(Collector)=0 ELEC=Collector VSTEP=0.5 NSTEP=10 CLOSE COMMENT SOLVE LOG SOLVE LOG Solve Ic for Ib=20uA V(Base)=[Value of VBE that corresponds to IB=20uA] V(Collector)=0.1 OUT.FILE=Ib20uA V(Collector)=0 ELEC=Collector VSTEP=0.5 NSTEP=10 CLOSE COMMENT SOLVE LOG SOLVE LOG Solve Ic for Ib=30uA V(Base)=[Value of VBE that corresponds to IB=30uA] V(Collector)=0.1 OUT.FILE=Ib30uA V(Collector)=0 ELEC=Collector VSTEP=0.5 NSTEP=10 CLOSE Following the pattern, repeat the above section of code for IB: 40 A and 50 A To plot the characteristics, add these lines: COMMENT Plot Ic vs. Vce output characteristics PLOT.1D Y.AXIS=I(Collector) X.AXIS=V(Collector) + TITLE="Ic vs. Vce" IN.FILE=Ib50uA PRINT LINE=2 POINTS COLOR=5 PLOT.1D Y.AXIS=I(Collector) X.AXIS=V(Collector) IN.FILE=Ib40uA + PRINT LINE=2 POINTS COLOR=4 UNCHANGE PLOT.1D Y.AXIS=I(Collector) X.AXIS=V(Collector) IN.FILE=Ib30uA + PRINT LINE=2 POINTS COLOR=3 UNCHANGE PLOT.1D Y.AXIS=I(Collector) X.AXIS=V(Collector) IN.FILE=Ib20uA + PRINT LINE=2 POINTS COLOR=2 UNCHANGE PLOT.1D Y.AXIS=I(Collector) X.AXIS=V(Collector) IN.FILE=Ib10uA + PRINT LINE=2 POINTS COLOR=1 UNCHANGE


