Document 14671584
advertisement
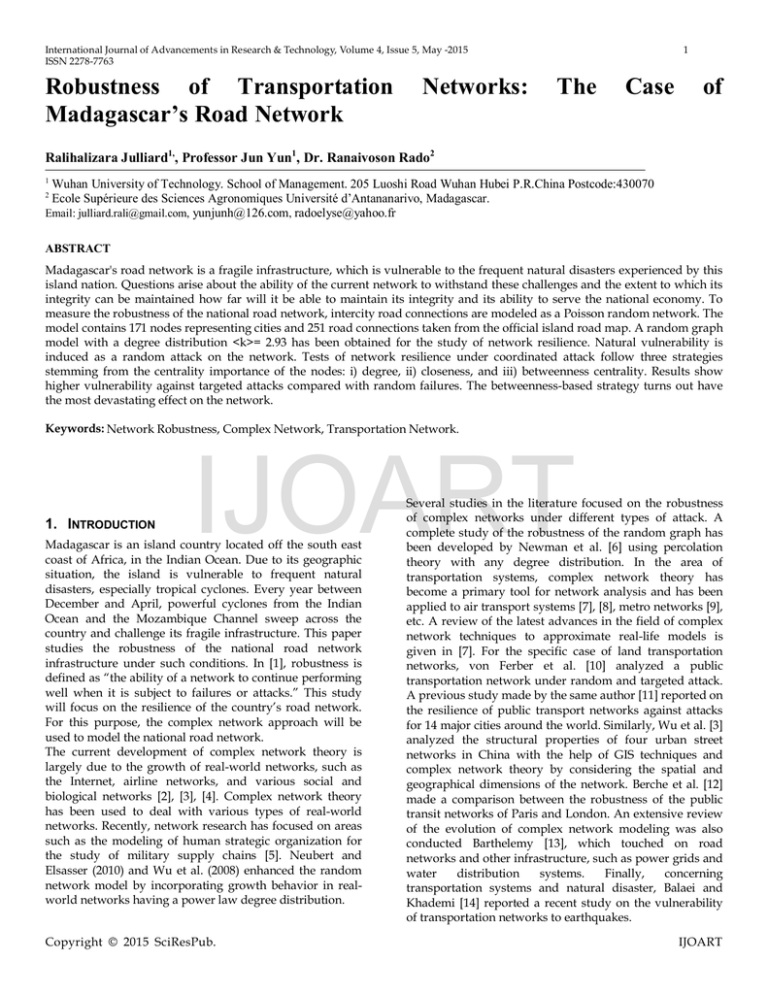
International Journal of Advancements in Research & Technology, Volume 4, Issue 5, May -2015 ISSN 2278-7763 Robustness of Transportation Madagascar’s Road Network Networks: 1 The Case of Ralihalizara Julliard1,, Professor Jun Yun1, Dr. Ranaivoson Rado2 1 Wuhan University of Technology. School of Management. 205 Luoshi Road Wuhan Hubei P.R.China Postcode:430070 Ecole Supérieure des Sciences Agronomiques Université d’Antananarivo, Madagascar. Email: julliard.rali@gmail.com, yunjunh@126.com, radoelyse@yahoo.fr 2 ABSTRACT Madagascar's road network is a fragile infrastructure, which is vulnerable to the frequent natural disasters experienced by this island nation. Questions arise about the ability of the current network to withstand these challenges and the extent to which its integrity can be maintained how far will it be able to maintain its integrity and its ability to serve the national economy. To measure the robustness of the national road network, intercity road connections are modeled as a Poisson random network. The model contains 171 nodes representing cities and 251 road connections taken from the official island road map. A random graph model with a degree distribution <k>= 2.93 has been obtained for the study of network resilience. Natural vulnerability is induced as a random attack on the network. Tests of network resilience under coordinated attack follow three strategies stemming from the centrality importance of the nodes: i) degree, ii) closeness, and iii) betweenness centrality. Results show higher vulnerability against targeted attacks compared with random failures. The betweenness-based strategy turns out have the most devastating effect on the network. Keywords: Network Robustness, Complex Network, Transportation Network. 1. INTRODUCTION IJOART Madagascar is an island country located off the south east coast of Africa, in the Indian Ocean. Due to its geographic situation, the island is vulnerable to frequent natural disasters, especially tropical cyclones. Every year between December and April, powerful cyclones from the Indian Ocean and the Mozambique Channel sweep across the country and challenge its fragile infrastructure. This paper studies the robustness of the national road network infrastructure under such conditions. In [1], robustness is defined as “the ability of a network to continue performing well when it is subject to failures or attacks.” This study will focus on the resilience of the country’s road network. For this purpose, the complex network approach will be used to model the national road network. The current development of complex network theory is largely due to the growth of real-world networks, such as the Internet, airline networks, and various social and biological networks [2], [3], [4]. Complex network theory has been used to deal with various types of real-world networks. Recently, network research has focused on areas such as the modeling of human strategic organization for the study of military supply chains [5]. Neubert and Elsasser (2010) and Wu et al. (2008) enhanced the random network model by incorporating growth behavior in realworld networks having a power law degree distribution. Copyright © 2015 SciResPub. Several studies in the literature focused on the robustness of complex networks under different types of attack. A complete study of the robustness of the random graph has been developed by Newman et al. [6] using percolation theory with any degree distribution. In the area of transportation systems, complex network theory has become a primary tool for network analysis and has been applied to air transport systems [7], [8], metro networks [9], etc. A review of the latest advances in the field of complex network techniques to approximate real-life models is given in [7]. For the specific case of land transportation networks, von Ferber et al. [10] analyzed a public transportation network under random and targeted attack. A previous study made by the same author [11] reported on the resilience of public transport networks against attacks for 14 major cities around the world. Similarly, Wu et al. [3] analyzed the structural properties of four urban street networks in China with the help of GIS techniques and complex network theory by considering the spatial and geographical dimensions of the network. Berche et al. [12] made a comparison between the robustness of the public transit networks of Paris and London. An extensive review of the evolution of complex network modeling was also conducted Barthelemy [13], which touched on road networks and other infrastructure, such as power grids and water distribution systems. Finally, concerning transportation systems and natural disaster, Balaei and Khademi [14] reported a recent study on the vulnerability of transportation networks to earthquakes. IJOART International Journal of Advancements in Research & Technology, Volume 4, Issue 5, May -2015 ISSN 2278-7763 2. METHODOLOGY The classical random network model [4], [15] is used to model the national road infrastructure network. Such networks have a binomial degree distribution that can be approximated by the Poisson law defined in (1) [13], [16], [17], [18]. 𝑃(𝑘) = 𝑒 −<𝑘> < 𝑘 >𝑘 , 𝑘! (1) where <k> is the average node degree of the network. The network model is constructed using the official road map issued by the national geography bureau (FTM). Road intersections are presented as nodes and routes as links [13]. The natural vulnerabilities due to tropical cyclones are translated into random attacks on the network while intentional attacks, which require a certain level of organization to implement, are modeled as targeted attacks [19]. In practice, both random and intentional attacks involve the successive removal of nodes from the network; however, for targeted attacks, three strategies have been retained to sense the robustness the network under each. Nodes are removed from the most important to the least important according to their rankings in i) degree centrality, ii) closeness centrality, and iii) betweenness centrality [3], [10]. The different notions of centralities used for this work are as follows [18]. If M = [a ij ] is the adjacency matrix of the connected graph with n dimensions, The degree centrality k i is the measure of the connectivity of the node i: been retained as a criterion of robustness [3], [5], [6], [10], [11]. The size of the giant component is a suitable criterion in the sense that after an attack, it provides information about how many cities are left to communicate and maintain economic activities. All maps required for the study have been processed with QGIS and simulations have been programmed and run under a MATLAB environment. 3. RESULTS The model network contains 171 inter-city road intersections and 251 routes, with a total of 25,186 km of roads. The average degree equals 2.93 and the degree frequency distribution of the random graph model is presented in Fig. 1. Degree Frequency Distribution 50 45 40 Degree 35 Frequency (%) For the present study of the robustness of road networks in Madagascar, this paper is organized in three parts: i) a summary of theoretical tools and methodologies from complex network theory used in the study; ii) a presentation of results; and iii) the conclusions and future outlook. 2 30 IJOART 𝑘𝑖 = � 𝑗∈𝑁 𝑎𝑖𝑗 . (2) The closeness centrality C ci is the measure of the accessibility of the node i on the network: n−1 𝐶𝑐𝑖 = , (3) ∑i,i≠j dij With d ij the length of the shortest path between nodes i and j. Betweenness centrality C bi measures how many times the node i serves as a bridge between two other nodes in the network: 𝜎𝑠,𝑡 (𝑣𝑖 ) 𝐶𝑏𝑖 = � � . (4) 𝑠≠𝑖 𝑠≠𝑡 𝜎𝑠,𝑡 This is the ratio between the number of shortest paths from node s to node t and crossing node i, and the total number of shortest paths between s and t. The literature provides various methods to measure the robustness of complex networks, such as the length of the shortest path in the network and/or clustering coefficients [20] In this paper, the size of the giant component [21] has Copyright © 2015 SciResPub. Poisson 25 20 15 10 5 0 1 2 3 4 5 6 7 8 9 10 Degree Fig. 1. Degree frequency distribution and Poisson distribution, real world network and the random graph model. The three centrality measures provide a classification of the nodes on the entire network. The five most important nodes of the network, according to the three centrality measures, are listed in Table 1. Table 1 Centrality ranking of cities Rank Degree Closeness Betweenness 1 Ambondromamy Nosy Varika Moramanga 2 Ambanja Vatomandry Mahanoro 3 Marovoay Moramanga Nosy Varika 4 Antananarivo Mahanoro Vatomandry 5 Ifanadiana Ifanadiana Ihosy Table 1 displays an inconsistency among the three centrality rankings; except for three cities that remain on the top five of the most important nodes of the network (Nosy Varika, Moramanga, and Ifanadiana). Fig. 2. is a plot of the size of the giant component against the fraction of nodes removed from the network. It summarizes the robustness of the network under random IJOART International Journal of Advancements in Research & Technology, Volume 4, Issue 5, May -2015 ISSN 2278-7763 and targeted attack. The targeted attack is coordinated after three strategies to match the three centralities rankings. Note that for the coordinated attack, the centrality ranking has to be updated before each step. The importance given to any particular node constantly changes during one sequence of attack. A record of the first sequences for each coordinated attack strategy is shown in Table 2. 1 Random 0.9 Degree Size of the Giant Component 0.8 Closeness Betweness 0.7 0.6 0.5 0.4 0.3 3 percolation limit of 34% functional nodes. Above this percolation limit, the entire network is fragmented. Similar to other studies [3], it is also shown by Fig. 2 and Table 2 that the national road infrastructure network is more resilient to random attacks compared with the three types of targeted attack. In fact, under a random attack, 10% damaged nodes on the network yields an 80% remaining functional network. However, the same amount of damage leaves only 21%, 39%, and 12% of the network functional from degree, closeness, and betweenness centrality, respectively. A successive attack starting from the most important node, according to betweenness centrality, yields faster collapse of the network than any other strategies. Hence, the node betweenness-based strategy is the most destructive among all strategies of attack, random and targeted. 0.2 0.1 0 0.000 0.100 0.200 0.300 0.400 0.500 0.600 0.700 0.800 0.900 1.000 Feaction of nodes removed Fig. 2. Response curves of the network under sustained attack strategies. Table 2: Attack Sequences nodes IJOART Degree Closeness Betweenness 1 Ambondromamy Nosy Varika Moramanga 2 Ambanja Antsirabe Ivato 3 Antananarivo Bekopaka Malaimbandy 4 Ifanadiana Ambohitralalalana Ambondromamy 5 Amboasary Antalaha Maintirano For the three targeted attack strategies, Fig. 3 presents a graphical overview of the geographical repartition of the centralities for the four first steps of the sequence. Degree centrality results are presented on the first column, the closeness centrality on the second column, and betweenness centrality on the last column. Fig. 3 provides a pictorial translation of the curves in Fig. 2. Once the first node is knocked out from the network, the weakness rapidly spreads all across the country. It has been found that for the inherent structure of the current network, the entire network has a very low closeness centrality score. After the fourth attack, the network converges to a state where the overall closeness centrality equals zero. For this case, a random strategy is adopted for the next strike until the network reaches a state where centrality can be computed. 4. DISCUSSION The model of Madagascar’s intercity road network as a random network shows that the road network is generally fragile. The results represented in Fig. 3 shows that after just a few attacks, an increasing number of nodes become network liabilities. The giant component exists under the Copyright © 2015 SciResPub. Fig. 3. Sequences of target nodes under targeted attacks following the degree centrality strategy (left), closeness centrality strategy (middle) and betweenness centrality strategy (right) IJOART International Journal of Advancements in Research & Technology, Volume 4, Issue 5, May -2015 ISSN 2278-7763 5. CONCLUSIONS A random network model of the country's road network gives us a deeper insight into the system’s resilience against frequent challenges as a whole. It has been demonstrated that the network is far more vulnerable to targeted than random attacks. From the literature, similar studies of public transport networks are mostly made for individual cities; in this case, a nationwide system has been used to study an entire network and its behavior. Therefore, this study contributes to our understanding of potential threats and informs the future design of a better network. As the primary transport system for the island, the road network plays several roles besides sustaining the domestic economy. This study opens several perspectives and can be taken as a starting point for studies related to nationwide networking in areas such as communications, emergency response, and controlling disease epidemics. References [1]. R. E. Kooij and W. Ellens, "Graph measures and network robustness," eprint arXiv 1311.5064, pp. 1–10, 2013. [2]. Andre Neubert and Robert Elsasser, "Toward Proper Random Graph Models for Real World Networks," IEE Computer Society 2010 Ninth International Conference on Networks, pp. 306–315, 2010. [3]. Qinmin Wu, Daoli Zhu, and Yihong Hu, "Topological patterns of spatial urban street networks," Wireless Communications, Networking and Mobile Computing, pp. 12-14, 2008. [4]. Maarten Van Steen, Graph theory and Complex Networks, Maarten Van Steen, ed., 2010. [5]. Raman Pall, Ahmed Ghanmi, and Robert Bryce, "On simulating the resilience of military hub and spoke networks," IEE Simulation Conference (WSC), 2013 winter, pp. 2902–2913, 2013. [6]. M. E. J. Newman, Steven H. Strogatz, Duncan J. Watts, and Duncan S. Callaway, "Network robustness and fragility: percolation on random graphs," The American Physical Society Volume 85, Number 25., pp. 5468:5471, 2000. [7]. Fabrizio Lillo and Massimiliano Zanin, "Modelling the air transport with complex networks: a short review," European Physical Journal Special Topics 215, pp. 5–21, 2013. [8]. Huihui Mo, Fahui Wang, Fengjun Jin, and Jiaoe Wang, "Exploring the network structure and nodal centrality of China’s air transport network: a complex network approach," Journal of Transport Geography, vol. 19, pp. 712–721, 2011. [9]. Derrible S, "Network centrality of metro systems," PLoS ONE 7(7): e40575. doi:10.1371/journal.pone.0040575, 2012. [10]. Christian von Ferber, Taras Holovatch, Yurij Holovatch, and Bertrand Berche, "Public transport networks under random failure and directed attack," Dynamics of Socio-Economic Systems, vol. 2, pp. 42–54, 2010. [11]. C. von Ferber, T. Holovatch, Yu. Holovatch, and B. Berche, "Resilience of public transport networks against attacks," Eur. Phys. J. B, vol. 71, pp. 125–137, 2009. [12]. B. Berche, T. Holovatch, Yu. Holovatch, and C. von Ferber, "A tale of two cities. Vulnerabilities of the London and Paris transit networks," J. Transp. Secur., vol. 5, pp. 199–216, 2012 [13]. Marc Barthelemy, "Spatial networks," Physics Reports, vol. 499, pp. 1–101, 2011. 4 [14]. Behrooz Balaei and Navid Khademi, "Transportation network vulnerability analysis for the case of a catastrophic earthquake," International Journal of Disaster Risk Reduction, vol. 12, pp 234– 254, 2015. [15]. Mathias Dehmer, Structural Analysis of Complex Networks. Springer, 2011. [16]. Ronald Meester and Massimo Franceschetti, Random Network for Communication. Cambridge series in statistical and probabilistic mathematics, 2011. [17]. R. Cohen and S. Havlin, Complex Networks Structure, Robustness and Function.: Havlin, 2010. [18]. V. Latorab,Y Morenod, M. Chavezf, D.-U. Hwanga, and S. Boccalettia, "Complex networks: structure and dynamics," Elsevier Physics Reports 424, pp. 175–308, 2006. [19]. Long Gao, Ruifang Liu, Shuguang Cui, and Qing Zhou, Network Robustness under Large-Scale Attacks. Springer, 2013. [20]. Wu Xiao, Chen Zhou Xuemei, "The study of reliability about the internal network of Shanghai South railway station based on the robustness of complex networks," International Conference on Optoelectronics and Image Processing (ICOIP), vol. 2, pp. 11–12, 2010. [21]. Bella Bollobas, Random Graph, Second edition, Cambridge Studies in Advanced Mathematics, 2001. IJOART Copyright © 2015 SciResPub. IJOART

