SPECT and PET Radionuclide Dosimetry - 2: Measurement of Radioactivity by 3-D
advertisement
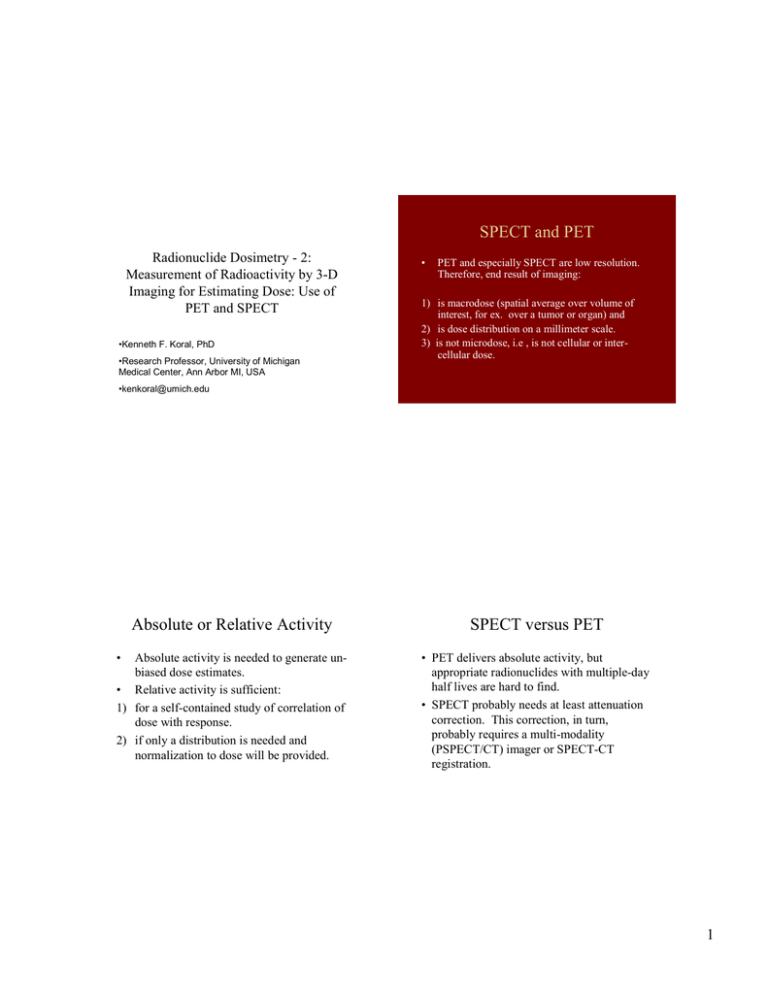
SPECT and PET
Radionuclide Dosimetry - 2:
Measurement of Radioactivity by 3-D
Imaging for Estimating Dose: Use of
PET and SPECT
•Kenneth F. Koral, PhD
•Research Professor, University of Michigan
Medical Center, Ann Arbor MI, USA
•
PET and especially SPECT are low resolution.
Therefore, end result of imaging:
1) is macrodose (spatial average over volume of
interest, for ex. over a tumor or organ) and
2) is dose distribution on a millimeter scale.
3) is not microdose, i.e , is not cellular or intercellular dose.
•kenkoral@umich.edu
Absolute or Relative Activity
SPECT versus PET
Absolute activity is needed to generate unbiased dose estimates.
• Relative activity is sufficient:
1) for a self-contained study of correlation of
dose with response.
2) if only a distribution is needed and
normalization to dose will be provided.
• PET delivers absolute activity, but
appropriate radionuclides with multiple-day
half lives are hard to find.
• SPECT probably needs at least attenuation
correction. This correction, in turn,
probably requires a multi-modality
(PSPECT/CT) imager or SPECT-CT
registration.
•
1
PET Radionuclides for Dosimetry
Possible PET Radionuclides for
Dosimetry
Radionuclide
Halflife
Comments
Radionuclide
Halflife
I-124
4.2 d
Cu-64
12.7 h
Zr-89
3.27 d
Y-86
14.7 h
High-energy ’s
in cascade with
’s.
Complication.
Surrogate for
Y-90. Needs
correction.
Comments
Under
consideration.
PET Radionuclides for Dosimetry
(2)
• References for I-124 procedure:
Pentlow et al. JNM 1996;37:1557-62.
• References for Y-86 correction:
Pentlow et al. Clin Pos Im 2000;3(3):85-90.
• Reference for Cu-64:
Philpott et al. JNM 1995;36:1818-24.
• Reference for Zr-89 labeling:
Verel et al. JNM 2003;44:1271-81.
2
Common SPECT Radionuclides
Radionuclide
Gamma
energy
I-131
364 keV
In-111
247 keV,
172 keV
Comments
Conversion Factor
To obtain absolute activity, one needs a
conversion factor from reconstructed counts
to activity (MBq/counts per second, for
example).
This conversion factor is frequently called the
system sensitivity.
Surrogate
for Y-90
PET Conversion Factor
1) Usually uses tomographic imaging of
a uniform cylinder of a given activity
density.
2) Image reconstruction requires same
attenuation compensation and scatter
correction as that used for the patient.
SPECT Conversion Factor
Planar imaging of a point source in air may be
used.
1) For this, and tomographic imaging of a sphere,
spatial location is usually assumed to be
unimportant.
2) The correct approach for point-source imaging
(or simulation) is not obvious:
3
SPECT Conversion Factor using
a Point Source
Using a point source, it seems obvious
that the reconstruction program, after
attenuation compensation and scatter
correction, needs to distribute one
projection image count over the image
space so as to yield an increment of a total
of one among the reconstructed voxels.
SPECT Conversion Factor using
a “Point” Source (3)
Gonzales-Trotter et al, IEEE TNS 2001;48:65-73
1) Calculated the geometric sensitivity of the
collimator.
2) Given that sensitivity, they measured the crystal
efficiency in air using a 1cm x 1cm vial
containing I-131.
3) Having both sensitivity and efficiency, they
calculated the equivalent of a conversion factor.
SPECT Conversion Factor using
a Point Source (2)
Ljungberg et al, JNM 2002;43:1101-9
1) Were after “narrow-beam” geometry.
2) Simulated a point source in a “scatter- and
attenuation-free environment” with septal
penetration not allowed.
3) Then used total counts.
SPECT Conversion Factor using
a Point Source (4)
Recall that:
The geometric efficiency is the fraction of
impinging gamma rays that get through
the collimator.
The crystal efficiency equals the probability
of a photopeak count, given a normallyincident gamma ray of the appropriate
energy.
4
SPECT Conversion Factor (3)
Tomographic imaging of
1) a uniform cylinder, or of
2) a geometry simulating the desired target(s), for
example, a sphere inside an elliptical cylinder.
3) Image reconstruction requires same attenuation
compensation and scatter correction as that used
for the patient.
Comparison of CF Dependence on SPECT Radius of
Rotation for Two Models
0.9
2 = 0.015
CF = 0.000*R + 0.739 r
0.7
2 = 0.910
CF = -0.003*R + 0.727 r
0.5
3D OSEM
1D SAGE
0.3
20
22
25
radius of rotation, R, cm
Comparison of CF Dependence on Background
Activity Level for Two Models
Test Phantom: 100-cubic-centimeter Sphere
Centrally-located below Lungs in Anthropomorphic
Phantom. No background activity.
1.0
CF = -0.116 b + 0.775
0.5
CF = 0.310 b + 0.594
3D OSEM
1D SAGE
0.0
0.0
0.1
0.2
0.3
0.4
background-to-target activity-concentration ratio, b
5
Bias and Noise Comparison for Total Activity
in Sphere using High-energy(HE) and Ultrahigh-energy (UHE) Collimation
• 3D OSEM
activity bias
UHE: -5.2% ± 8.6%
HE: -7.3% ± 5.7%
• 1D SAGE
activity bias
UHE: -10.7% ± 2.4%
HE: -4.3% ± 7.4%
Macrodose definition
The macrodose is the energy
deposited in a volume, divided by the
mass of that volume.
Appropriate Volume (1)
Appropriate Volume (2)
For a tumor, appropriate volume may be:
1) Entire volume of tumor as defined on CT
2) Proliferating volume as defined by high
uptake with therapeutic
radiopharmaceutical, or with proliferationspecific radiopharmaceutical.
However, especially for a bone metastasis, and
even for other occult metastasis, the lesion may
not be seen on CT, so:
1) it may not be possible to define its volume from
CT
2) one may need to define the volume on the
SPECT image, and the accuracy may be low.
6
Appropriate Volume (3)
Also:
1) Tumor volume is usually assumed to be constant
during time radiation dose is delivered
2) But, in non-Hodgkin’s lymphoma treated with I131-Lym 1, superficial cancerous lymph nodes
decreased in volume during therapy. The dose
correction was more than a factor of 2 in >50%
(Hartmann-Siantar et al. JNM 2003;44:1322-9).
Time Course
1. From a complete series of tomographic images
obtained during therapy.
2. From a similar series during evaluation with the
assumption kinetics during therapy are same and
activity scales by ratio of administered activities.
3. From an evaluation conjugate-view time series
with activity-magnitude scaling based on a
single intra-therapy SPECT measurement.
Appropriate Volume (4)
Proliferation-specific radiopharmaceuticals:
Require an additional scan.
Often use DNA synthesis as a marker since a high
proliferation rate implies a high rate of DNA synthesis
{Schwartz et al, JNM2003;44:2027-32}.
3) Examples of DNA synthesis-radiopharmaceuticals are
131-I-iododeoxyuridine (131IdU) and radiolabeled
thymidine (TdR).
1)
2)
Time Course by Scaling Evaluationconjugate-view Composite-tumor Timeactivity Curve by Intra-therapy SPECT
Activity Estimates for Individual Tumors
• Method explained in Koral et al.Cancer
Biother&Raiopharm 2000;15(4):347-355.
• Conjugate-view activity is first distributed
among component individual tumors
corresponding to their volume.
• Scaling factors are used to get final doses.
7
Time Course for Different Individual Tumors is
Similar. Intra-therapy SPECT Evaluation
Comparison of Time Course with Intra-therapy
SPECT (Sum of 4 Tumors) versus Evaluative
Conjugate-Views (Corresponding Composite
Tumor)
1.5
SPECT, sum of 4
tumors, norm.
1.5
superior tumor
conjugate views
inferior tumor
1.0
1.25
mid left tumor
mid right tumor
1
0.5
0.75
0.5
0.0
time after infusion, hrs
time after infusion, hrs.
Activity Time Course
By Tracer SPECT, Tumors Fell into Two
Groups for pt 43
0.25
• Conclusion is that evaluation activity time
course for a composite tumor from
conjugate views matches the average time
course for individual tumors from intratherapy SPECT.
• However, in another patient, tracer SPECT
indicates activity-time-course variation
between individual tumors:
lfaor
0.2
rtaor
0.4
ant
lfaor3
lfaor4
0.15
ant2
0.3
ant3
ant 4
0.1
0.2
0.05
0.1
0
time after infusion, hrs
time after infusion, hrs
• Time activity shape was different. Within each
group, normalization at earliest time point.
8
By Tracer SPECT, Tumors Fell into Two
Groups for pt 64
0.5
0.5
lf aor
0.4
0.3
rt sup
rt aor
lf sup
med aor
0.4
big
Correlation of Radiation Dose from Intratherapy Hybrid SPECT versus that from
Evaluative Conjugate Views.
Individual Tumors.
1.5
0.3
1
0.2
0.2
0.1
0.1
0.0
0.0
0.5
time after infusion (hrs)
time after infusion (hrs)
• Time activity shape was different. Within each
group, normalization at earliest time point.
Volume Reduction versus Radiation Dose.
Small (<10g) Individual Tumors in PR
Patients
0
conjugate-view %ID
Volume Reduction versus Radiation Dose.
Individual Tumors in PR Patients (2)
• Reference is Koral et al.Cancer
2002;94(4S):1258-63.
• Tentative conclusion is that for this
application, the hybrid SPECT method
gives better results than conjugate views
alone.
A) With hybrid SPECT. B) With conjugate views.
9
Patient’s Average Tumor Radiation Dose.
Versus his/her Response (PR or CR)
8,000
3,000
0
PR
CR
Response category
A) hybrid SPECT
Mean different? p=0.18
0
PR
CR
Response category
Patient’s Average Tumor Radiation Dose.
Versus his/her Response (PR or CR) (2)
• Reference is Koral et al.JNM 2003;44:45764.
• Tentative conclusion is that for this
application, the hybrid SPECT method
gives only marginally better results than
conjugate views alone. (Only a large hybrid
average dose is effective for prediction.)
B) conjugate views
p=0.25
Tumor Dose Uniformity Correlates with
Volume Reduction
Uniformity versus Volume Reduction (2)
• Post-therapy volume reduction correlates
with tumor uniformity. r = 0.37, p=0.06.
• Reference is Sgouros et al. JNM
2003;44:260-268.
• Uniformity was measured by SPECT and
assessed by min/max dose.
10
3D Patient-specific Dose
• The following slides are courtesy of Dr.
Yuni Dewaraja, University of Michigan.
• Abstract reference is Dewaraja et al. JNM
2004;45(5):54P.
Accurate dose estimation in I-131
radionuclide therapy
• I-131 radionuclide therapy studies (RIT, MIBG) have not
shown a strong dose-response relationship
– possibly due to inaccuracies in activity quantification and dose
estimation.
• The goal of the present work was to establish that accurate
dosimetry is possible.
– 3D SPECT combined with 3D patient-specific dosimetry
• In the future, the 3D methods will be used to potentially
establish a dose-response relationship.
3-D SPECT reconstruction
• 3D OSEM reconstruction included
– Depth dependant detector response
– Patient specific attenuation correction
– Triple energy window scatter compensation
– Counts to activity conversion based on imaging
a known activity hot-sphere in a warm
background ellipsoid phantom
3D patient-specific dosimetry
• Monte Carlo dose calculation using the new DPM
(Dose Planning Method) code
– code from external beam therapy adapted here for
internal therapy
– fast, validated
– inputs are
• co-registered SPECT image and CT density map.
• masks defining tumors and organs
– output is
• 3D dose-rate distribution
tumor dose-volume histograms, average dose
11
Simulation studies: evaluation of
quantification and dosimetry
• Voxel phantom with tumors in abdominal region
• Realistic activity map based on RIT patient data
– relative concentration: tumors, 25; blood, 12; kidney,
20; liver, 7; lung, 7; spleen, 13; rest of body, 1
Phantom-based evaluations
Projections
3D OSEM
SPECT
SPECT dose-rate
DPM
SIMIND
convert
to dose
Voxel phantom
Density
COMPARE
Activity
Density
convert
to dose
DPM
Two slices of the voxel phantom activity map
Phantom based evaluations
Activity
quantification
DPM
3D dosimetry
Organ
True
activity
Mbq
7 cc tumor
2.9
16 cc tumor 6.4
59 cc tumor 23.0
135 cc tumor 52.8
liver
205.2
kidney
152.5
spleen
72.5
Organ
%TrueÓ
dose
cGy
7 cc tumor
1308.8
16 cc tumor 1344.8
59 cc tumor 1450.0
135 cc tumor 1458.3
liver
500.2
kidney
1160.1
spleen
812.7
SPECT
based mean
activity
Mbq
1.8
5.9
20.6
53.0
200.9
138.3
70.2
SPECT
based mean
dose
cGy
897.8
1274.1
1356.7
1493.3
502.3
1098.6
812.6
Error
%
38.4
7.9
10.3
-0.5
2.1
9.3
3.2
Relative
standard
deviation
%
9.4
2.2
1.2
0.9
0.4
0.5
0.7
Error
%
31.4
5.3
6.4
-2.4
-0.4
5.3
0.0
Relative
standard
deviation
%
8.0
1.9
1.0
0.8
0.3
0.4
0.6
“true” dose-rate
3D Dosimetry: RIT Patient Study
X-Ray CT
DPM
3D DOSE-RATE MAP
REGISTERED 3D SPECT
12
Dose Volume Histogram for Patient
90
0.08
80
0.08
60
50
East
West
North
0.04
40
30
Volume fraction
Volume fraction
70
0.06
20
0.02
10
0
0
1st Qtr
0
2nd Qtr
0.2
3rd Qtr
0.4
4th Qtr
0.6
Fraction of maximum dose
0.8
0.06
0.04
0.02
1
0
0
Patient study: Conversion of SPECTbased 3D dose-rate to dose
• Only one SPECT time point was available
• Planar imaging time-activity curves used for
residence times
– total body residence time: must account for limited
SPECT field of view
– tumor residence time: accuracy can be improved by
combining results of conjugate-view and quantitative
SPECT at the single time point
0.2
0.4
0.6
Fraction of maximum dose
0.8
1
Patient example: comparison of 3D
and conventional dosimetry
Tumor -->Tumor
Rest of body --> Tumor
Total
3D DPM
485.1(88%)
69.0 (12%)
554.1
Average tumor dose (cGy)
Conventional
487.7 (95%)
28.1 (5%)
515.9
• Compared with DPM, conventional dosimetry
significantly underestimates the rest of the body
contribution to tumor dose in this patient.
• DPM average tumor dose is 7% higher than
conventional
13
Future Work
Summary
• Goal is to carry out I-131 RIT results of Koral et al with conventional dosimetry
3D SPECT
reconstruction
followed by patient
specific 3D
dosimetry for several
patients and reevaluate relationship
between dose and
volume reduction
Tumor absorbed Dose (cGy)
100
80
60
40
20
0
0
400
800
1200
1600
2000
• Phantom studies showed that accurate I-131 dose
estimation is possible with 3D methods for SPECT
reconstruction and dosimetry.
– Errors better than 6.5% for tumor/organs down to 16 cc
• When applied to a patient, the average tumor dose was 7%
higher with the new calculation compared with
conventional MIRD-based calculation.
– Possibly due to more accurate calculation of the rest of the body
photon dose contribution
• New 3D methods will be applied to existing I-131 RIT
patient data and dose-volume reduction relationship will be
re-evaluated.
14
