vii ii iii
vii
2
1
CHAPTER
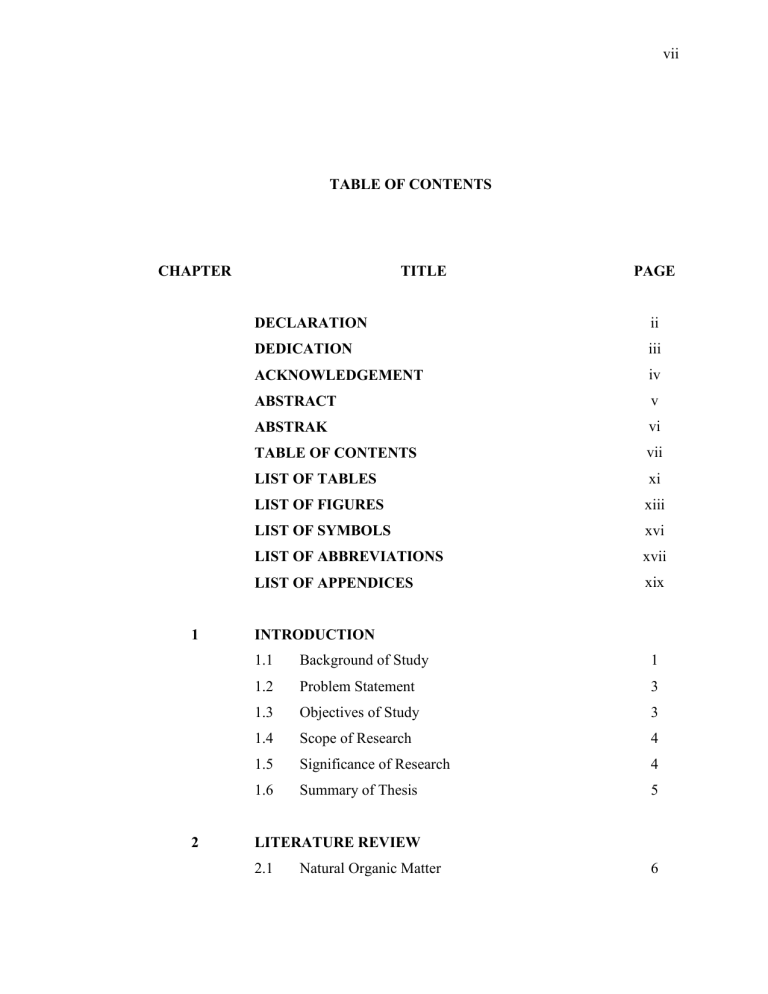
TABLE OF CONTENTS
TITLE
DECLARATION
DEDICATION
ACKNOWLEDGEMENT
ABSTRACT
ABSTRAK
TABLE OF CONTENTS
LIST OF TABLES
LIST OF FIGURES
LIST OF SYMBOLS
LIST OF ABBREVIATIONS
LIST OF APPENDICES
INTRODUCTION
1.1 Background of Study
1.2 Problem Statement
1.3 Objectives of Study
1.4 Scope of Research
1.5 Significance of Research
1.6 Summary of Thesis
LITERATURE REVIEW
2.1 Natural Organic Matter
PAGE ii iii iv v vi vii xi xiii xvi xvii xix
3
3
1
4
4
5
6
2.1.1 Humic Substances
2.1.2 Humic Acid and Fulvic Acid in Surface
Water
2.2 Trihalomethane Formation Health Issues
2.3 Factor Effecting THM Formation
2.3.1
Effect of Total Organic Carbon
2.3.2
Effect of Chlorine as Disinfectant Agent
2.3.3
Effect of pH and Reaction Time
2.3.4
Effect of Temperature
2.3.5
Effect of Bromide Ion
2.4 Treatment and Control of THM
2.4.1
Water Treatment Plant Process
2.4.2
Reduction of Total Organic Carbon
2.4.3
Modification of Disinfection Process
2.4.4
Elimination of THM after Formation
2.4.5
Modeling of TTHM Formation Potential
2.5 Analysis of Trihalomethanes
2.5.1
Purge and Trap Gas Chromatography –
Mass Spectrometric Method
2.5.2
Heated Persulfate Oxidation Method
(APHA 5310 C) HAACH Organic
2.5.3
Liquid-liquid Extraction
2.5.4
Direct Aqueous Injection Technique
2.5.5
Headspace-Solid Phase Microextraction
2.6 Miniaturized LLE Techniques
2.6.1
Single Drop Microextraction Technique
2.6.2
Dispersive Liquid-liquid
Microextraction
2.6.2.1 Principle of DLLME
2.6.2.2 Parameters affecting Extraction
Efficiency of DLLME
2.6.2.3 Application of DLLME viii
25
25
25
27
29
29
30
31
32
34
7
8
9
14
14
15
16
17
18
19
19
21
21
23
23
24
24
3
4
EXPERIMENTAL
3.1 Introduction
3.2 Chemicals and Reagents
3.3 Instrumentation and Apparatus
3.4 Sampling of River Water
3.5 Procedure
3.5.1
Preparation of standard THM mixture
3.5.2
Dispersive Liquid-liquid Microextraction
3.5.3
Liquid-liquid Extraction
3.6
3.7
3.5.4
Total Organic Carbon Analysis
Optimization of DLLME Technique
Parameters for Method Validation
OPTIMIZATION OF DLLME
4.1 Background of Chapter
4.2 Separation of THMs using GC-ECD
4.3 Optimization of DLLME
4.3.1
Type and Volume of Extraction Solvent
4.3.2
Type and Volume of Disperser Solvent
4.3.3
Extraction Time
4.3.4
Addition of Salt
4.4 Performance of DLLME Technique
4.4.1
Repeatability, Reproducibility and
Recovery
4.4.2
Linearity
4.4.3
Detection Limit
4.4.4
Enrichment Factor
4.5 Method Comparison
4.5.1
Comparison of GC Methods
4.5.2
Comparison of Extraction Technique
54
55
56
57
59
49
49
51
52
45
45
46
36
43
44
44
36
37
38
43
64
66
60
62
62
63 ix
5
5.2 Sampling of River Water
5.3 TOC Analysis
5.4 THMs Analysis using DLLME-GC-ECD
5.5
TTHMFP at Johor Darul Ta’zim, Malaysia
6
REFERENCES
CONCLUSIONS AND SUGGESTIONS
6.1 Conclusions
6.2 Suggestions
APPENDIX
MONITORING OF RIVER WATER
5.1 Background of Chapter 69
84
86
69
74
76
80
89
99 x
xi
TABLE NO.
2.1
2.2
2.3
2.4
3.1
3.2
3.3
4.1
4.2
4.3
4.4
4.5
4.6
4.7
4.8
4.9
LIST OF TABLES
LIST OF TABLES
DBPs and its health effects
Guidelines for national drinking water quality standard for THMs
Comparison of detection limit from various methods of
THM analysis
Application of DLLME in water samples and the ratio of extraction solvent to disperser solvent
Operation conditions for GC-ECD
Samples label according to date of sampling carried out
Optimization of volume of extraction solvent for DLLME
Retention time of THMs studied
Linearity and detection limit of standard THMs analysed using GC-ECD via direct injection
Calibration result of standard THMs of DLLME-GC-
ECD analysis
Analytical performance in terms of limit of detection
Analytical performance in terms of enrichment factor
Comparison of instrument detection limit for THMs compound
Comparison of linearity and LOD of DLLME technique coupled with GC-MS and GC-ECD
Comparison of repeatability, reproducibility, recovery and EF of DLLME technique coupled with GC-MS and
GC-ECD
Calibration result of standard THMs and LODs of LLE-
GC-ECD analysis
PAGE
12
13
26
34
59
62
63
64
65
65
67
37
43
46
50
51
4.10
5.1
5.2 xii
68 Comparison of EF, repeatability, reproducibility and recovery of LLE-GC-ECD and DLLME-GC-ECD
Variation of temperature, pH and DO for river waters sampled during wet season
Concentrations of THMs and TTHM of Sungai
Sembrong, Sungai Simpang Kanan and Sungai Bekok during wet season, analyze using DLLME/GC-ECD
70
78
xiii
LIST OF FIGURES
LIST OF FIGURES FIGURE NO.
2.1 The predicted structural model of humic acid
2.2 The predicted structural model of fulvic acid
2.3
2.4
2.5
Schematic diagram of water treatment plant processes
Schematic diagram of HS-SPME technique
2.6
3.1
3.2
Schematic diagram of SDME technique with headspace and direct modes
Schematic diagram of DLLME technique.
Land map of Batu Pahat district, Johor Darul Ta’zim
First Intake Point, Sungai Sembrong, Parit Raja. Map scale: 1 cm = 10 ft of land
3.3
3.4
4.1
4.2
Second Intake Point, Sungai Simpang Kanan, Batu Pahat.
Map scale: 1 cm = 10 ft of land
Third Intake Point, Sungai Bekok, Yong Peng, Batu
Pahat. Map scale: 1 cm = 10 ft of land
GC chromatogram for direct injection of THMs standard mixture. GC conditions: HP-5MS column (30 m x 0.25 mm x 0.25 µm), Injector: 250 o
C, Detector: 300 o
C, Oven: initial temperature at 50 at a rate of 5 o o
C for 2 min, increased to 100
C/min, increased to 200 o
C at a rate of o
C
30 o
C/min, and held at 200 o
C for 1 min. Peaks identification: (1) Chloroform, 0.2 mg/L, (2)
Bromodichloromethane, 0.08 mg/L, (3)
Dibromochloromethane, 0.04 mg/L, (I.S) (internal standard) 1,2-dibromopropane, 0.04 mg/L and (4)
Bromoform, 0.08 mg/L
Average volume (± SD) of settled phase formed with different volume of CS
2
used where SD based on n = 3.
Extraction conditions: 1 mL of disperser solvent
(methanol), 3 min extraction with no salt addition
PAGE
8
9
20
27
30
31
39
40
41
42
50
53
4.3
4.4
4.5
4.6
4.7
4.8
4.9
5.1
5.2 xiv
Effect of the volume of CS
2
(extraction solvent) and the
EFs obtained for THMs by DLLME. Extraction conditions as in Figure 4.2
Effect of the volume of methanol (disperser solvent) and the EFs of THMs obtained by DLLME. Extraction conditions: 20 µL of extraction solvent (CS
2
), 3 min extraction with no salt addition
Effect of the time of centrifugation and the EFs achieved for THMs by DLLME. Extraction conditions: 20 µL of extraction solvent (CS
2
), 0.25 mL of disperser solvent
(methanol) with no salt addition
Effect of NaCl concentration and the EFs of THMs by
DLLME. Extraction conditions: 20 µL of extraction solvent (CS
2
), 0.25 mL of disperser solvent (methanol) and 2 min centrifugation
GC chromatogram of (a) blank DLLME and (b) standard
THMs mixture with optimizes condition of DLLME technique. Extraction conditions: 20 µL CS
2
with 0.25 mL of methanol as the extraction and disperser solvent respectively. Centrifugation for 2 min at 4,000 rpm and without any addition of salt. Peaks identification: (1)
Chloroform, (2) Bromodichloromethane, (3)
Dibromochloromethane, (I.S) (internal standard) 1,2dibromopropane and (4) Bromoform. GC conditions as in
Figure 4.1
Calibration graph of THMs under study: (a) chloroform,
(b) bromodichloromethane and bromoform and (c) dibromochloromethane using DLLME technique with optimum conditions
GC chromatogram for LLE-GC-ECD of THMs standard mixture. GC conditions: HP-5 column (30 m x 0.25 mm x
0.25 µm), Injector: 250 temperature at 50 o o
C, Detector: 300 o
C, Oven: initial
C for 2 min, increased to 100 o
C at a rate of 5 o
C/min, increased to 200 and held at 200 o
C at a rate of 30 o
C/min, o
C for 1 min. Peaks identification: (1)
Chloroform, (2) Bromodichloromethane, (3)
Dibromochloromethane, (I.S) (internal standard) 1,2dibromopropane and (4) Bromoform
Land use map for Batu Pahat district, at sampling area of
(A) Sungai Sembrong and (B) Sungai Simpang Kanan
Land use map for Batu Pahat district, at sampling area of
(C) Sungai Bekok
53
55
56
57
58
61
67
72
73
5.3
5.4
5.5
5.6
5.7
5.8
5.9
TOC profile of water samples of Sungai Sembrong,
Sungai Simpang Kanan and Sungai Bekok from October,
17 th
until December, 26 th
year 2010
Type of soils at Batu Pahat for Sungai Sembrong, Sungai
Simpang Kanan and Sungai Bekok areas
GC Chromatograms obtained for DLLME for (a) water sample spiked with THMs standard and (b) water sample with internal standard. GC Condition: Injector: 250 o
C,
Detector: 300 o
C, Oven: initial temperature at 50 min, increased to 100 o
200 o
C at a rate of 30 o
C for 2 o
C at a rate of 5 o
C/min, increased to
C/min, and held at 200 o
C for 1 min.
Peaks identification: (1) Chloroform, (2)
Bromodichloromethane, (3) Dibromochloromethane, I.S
(internal standard) 1,2-dibromopropane and (4)
Bromoform
The pattern of TTHM formation at Sungai Sembrong,
Sungai Simpang Kanan and Sungai Bekok, Johor during wet season (October to December 2010)
The values of pH and concentration of TTHM recorded at
Sungai Sembrong (SG), Sungai Simpang Kanan (SK) and
Sungai Bekok (BK), Johor during wet season (October to
December 2010)
Variation of temperature and concentration of TTHM recorded at Sungai Sembrong (SG), Sungai Simpang
Kanan (SK) and Sungai Bekok (BK), Johor during wet season (October to December 2010)
The concentrations of DO and TTHM recorded at Sungai
Sembrong (SG), Sungai Simpang Kanan (SK) and Sungai
Bekok (BK), Johor during wet season (October to
December 2010)
74
75
77
79
81
82
83 xv
µg/L mg/L
μL mL o
C m mm
µm
R
2 ppm ppb min w/v o
C/min mL/min
I.S
LIST OF SYMBOLS
–
Microgram per liter
–
Milligram per liter
–
Microliter
–
Milliliter
–
Degree Celcius
–
Meter
–
Millimeter
–
Micrometer
–
Correlation coefficients
–
Parts per million
– Parts per billion
– Minute
– Weight per volume
– Degree celcius per minute
–
Milliliter per minute
–
Internal standard xvi
GC-ECD
GC-MS
SDME
P&T
DAI
TOC
VOC
HA
FA
USEPA
CAR/PDMS
NOM
THM
THMs
TTHMs
TTHMFP
HAAs
DBP
CHCl
3
CHBrCl
2
CHBr
2
Cl
CHBr
3
DLLME
LLE
HS-SPME
LIST OF ABBREVIATIONS
–
Natural Organic Matter
–
Trihalomethane
–
Trihalomethanes
–
Total trihalomethanes
–
Total trihalomethane formation potential
–
Haloacetic acids
–
Disinfection by-product
–
Chloroform
–
Bromodichloromethane
–
Dibromochloromethane
– Bromoform
– Dispersive Liquid-liquid Microextraction
– Liquid-liquid Extraction
– Headspace – Solid Phase Microextraction
–
Gas Chromatography – Electron Capture Detection
–
Gas Chromatography – Mass Spectrometry
–
Single Drop Microextraction
–
Purge and Trap
–
Direct Aqueous Injection
–
Total Organic Carbon
–
Volatile Organic Compound
–
Humic Acid
–
Fulvic Acid
–
United States Environmental Protection Agency
–
Carboxen/polydimethylsiloxane xvii
PDMS/DVB
DO
WTP
– Polydimethylsiloxane/divinylbenzene
– Dissolve Oxygen
–
Water Treatment Plant
–
Carbon disulfide CS
2
NaCl
TC
–
Sodium chloride
–
Total carbon
IC
–
Inorganic carbon
DLLME-GC-ECD
–
DLLME followed by GC-ECD
DLLME-GC-MS
LLE-GC-ECD
LOD
LOQ
–
DLLME followed by GC-MS
–
LLE followed by GC-ECD
–
Limit of Detection
–
Limit of Quantitation
EF
ER
WHO
–
Enrichment factor
–
Extraction recovery
–
World Health Organization xviii
xix
LIST OF APPENDICES
APPENDIX LIST OF APPENDICES
A Publications
B
C
D
Presentations
Rainfalls for Batu Pahat area (October – December,
2010)
Type of soil at Sungai Sembrong area, Mukim Sri
Gading, Batu Pahat
E
F
Type of soil at Sungai Simpang Kanan area, Mukim
Simpang Kanan, Batu Pahat
Type of soil at Sungai Bekok area, Mukim Chaah
Baru, Yong Peng, Batu Pahat, Johor.
PAGE
99
101
102
103
104
105
