10. 1. 2. a)
advertisement
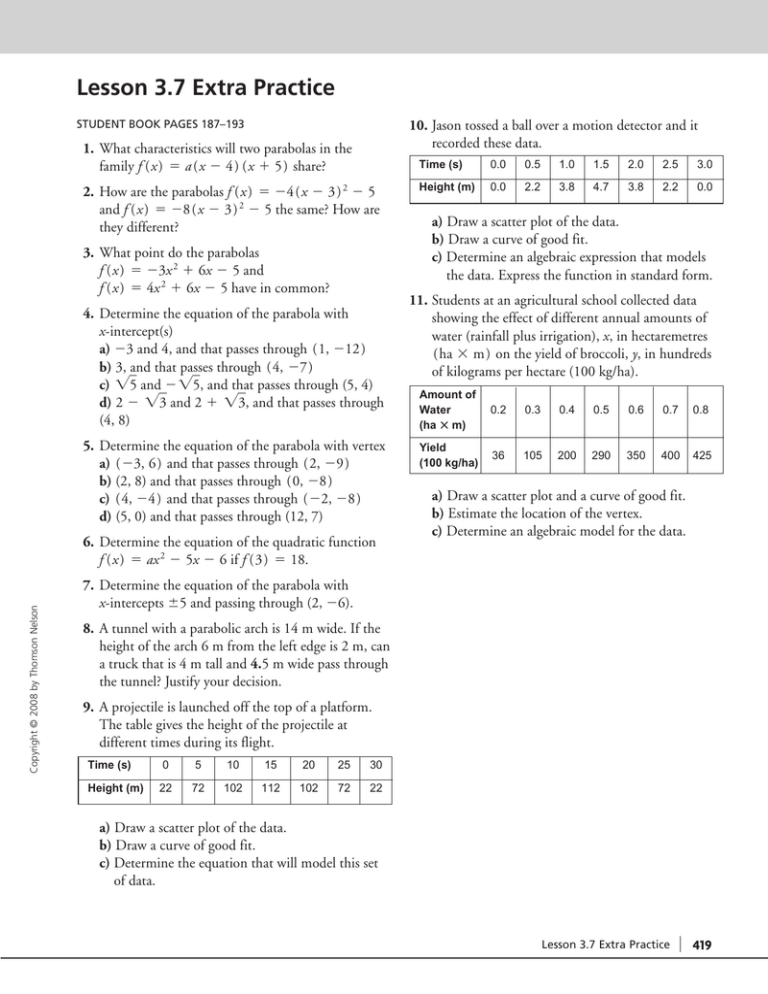
Lesson 3.7 Extra Practice STUDENT BOOK PAGES 187–193 10. Jason tossed a ball over a motion detector and it recorded these data. 1. What characteristics will two parabolas in the family f (x) ⫽ a(x ⫺ 4 ) (x ⫹ 5 ) share? 2. How are the parabolas f (x) ⫽ ⫺4 (x ⫺ 3) 2 ⫺ 5 and f (x) ⫽ ⫺8 (x ⫺ 3 ) 2 ⫺ 5 the same? How are they different? 3. What point do the parabolas f (x) ⫽ ⫺3x 2 ⫹ 6x ⫺ 5 and f (x) ⫽ 4x 2 ⫹ 6x ⫺ 5 have in common? 4. Determine the equation of the parabola with x-intercept(s) a) ⫺3 and 4, and that passes through (1, ⫺12) b) 3, and that passes through (4, ⫺7 ) c) 兹5 and ⫺兹5, and that passes through (5, 4) d) 2 ⫺ 兹3 and 2 ⫹ 兹3, and that passes through (4, 8) 5. Determine the equation of the parabola with vertex a) (⫺3, 6 ) and that passes through (2, ⫺9) b) (2, 8) and that passes through (0, ⫺8) c) (4, ⫺4 ) and that passes through (⫺2, ⫺8) d) (5, 0) and that passes through (12, 7) Copyright © 2008 by Thomson Nelson 6. Determine the equation of the quadratic function f (x) ⫽ ax 2 ⫺ 5x ⫺ 6 if f (3) ⫽ 18. Time (s) 0.0 0.5 1.0 1.5 2.0 2.5 3.0 Height (m) 0.0 2.2 3.8 4.7 3.8 2.2 0.0 a) Draw a scatter plot of the data. b) Draw a curve of good fit. c) Determine an algebraic expression that models the data. Express the function in standard form. 11. Students at an agricultural school collected data showing the effect of different annual amounts of water (rainfall plus irrigation), x, in hectaremetres (ha ⫻ m) on the yield of broccoli, y, in hundreds of kilograms per hectare (100 kg/ha). Amount of Water (ha ⫻ m) 0.2 0.3 0.4 0.5 0.6 0.7 0.8 Yield (100 kg/ha) 36 105 200 290 350 400 425 a) Draw a scatter plot and a curve of good fit. b) Estimate the location of the vertex. c) Determine an algebraic model for the data. 7. Determine the equation of the parabola with x-intercepts ⫾5 and passing through (2, ⫺6). 8. A tunnel with a parabolic arch is 14 m wide. If the height of the arch 6 m from the left edge is 2 m, can a truck that is 4 m tall and 4.5 m wide pass through the tunnel? Justify your decision. 9. A projectile is launched off the top of a platform. The table gives the height of the projectile at different times during its flight. Time (s) 0 5 10 15 20 25 30 Height (m) 22 72 102 112 102 72 22 a) Draw a scatter plot of the data. b) Draw a curve of good fit. c) Determine the equation that will model this set of data. Lesson 3.7 Extra Practice 419
