Monitoring the Plaster Creek Watershed Introduction Methods
advertisement

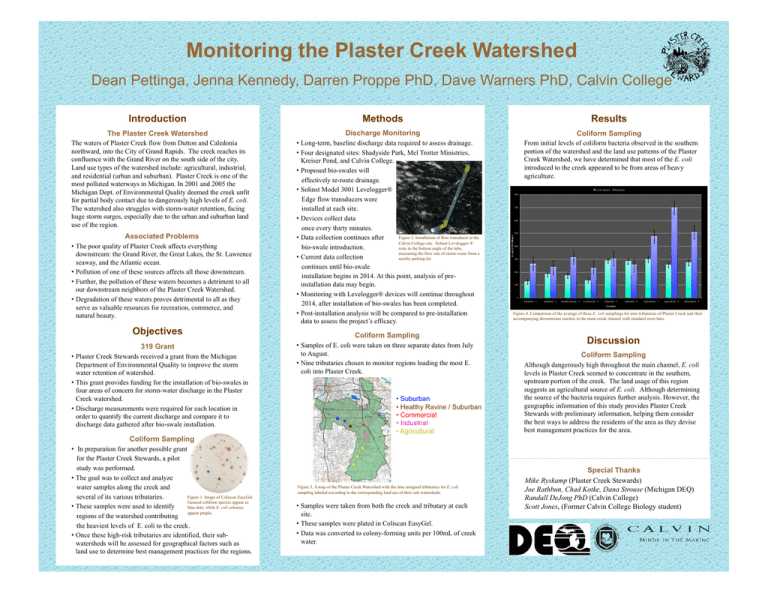
Monitoring the Plaster Creek Watershed Dean Pettinga, Jenna Kennedy, Darren Proppe PhD, Dave Warners PhD, Calvin College The Plaster Creek Watershed The waters of Plaster Creek flow from Dutton and Caledonia northward, into the City of Grand Rapids. The creek reaches its confluence with the Grand River on the south side of the city. Land use types of the watershed include: agricultural, industrial, and residential (urban and suburban). Plaster Creek is one of the most polluted waterways in Michigan. In 2001 and 2005 the Michigan Dept. of Environmental Quality deemed the creek unfit for partial body contact due to dangerously high levels of E. coli. The watershed also struggles with storm-water retention, facing huge storm surges, especially due to the urban and suburban land use of the region. Associated Problems • The poor quality of Plaster Creek affects everything downstream: the Grand River, the Great Lakes, the St. Lawrence seaway, and the Atlantic ocean. • Pollution of one of these sources affects all those downstream. • Further, the pollution of these waters becomes a detriment to all our downstream neighbors of the Plaster Creek Watershed. • Degradation of these waters proves detrimental to all as they serve as valuable resources for recreation, commerce, and natural beauty. Objectives 319 Grant • Plaster Creek Stewards received a grant from the Michigan Department of Environmental Quality to improve the storm water retention of watershed. • This grant provides funding for the installation of bio-swales in four areas of concern for storm-water discharge in the Plaster Creek watershed. • Discharge measurements were required for each location in order to quantify the current discharge and compare it to discharge data gathered after bio-swale installation. Coliform Sampling • In preparation for another possible grant for the Plaster Creek Stewards, a pilot study was performed. • The goal was to collect and analyze water samples along the creek and Figure 1. Image of Coliscan EasyGel. several of its various tributaries. General coliform species appear as • These samples were used to identify blue dots, while E. coli colonies appear purple. regions of the watershed contributing the heaviest levels of E. coli to the creek. • Once these high-risk tributaries are identified, their subwatersheds will be assessed for geographical factors such as land use to determine best management practices for the regions. Methods Results Discharge Monitoring • Long-term, baseline discharge data required to assess drainage. • Four designated sites: Shadyside Park, Mel Trotter Ministries, Kreiser Pond, and Calvin College. • Proposed bio-swales will effectively re-route drainage. • Solinst Model 3001 Levelogger® Edge flow transducers were installed at each site. • Devices collect data once every thirty minutes. Figure 2. Installation of flow transducer at the • Data collection continues after Calvin College site. Solinst Levelogger ® bio-swale introduction. rests in the bottom angle of the tube, measuring the flow rate of storm-water from a • Current data collection nearby parking lot. continues until bio-swale installation begins in 2014. At this point, analysis of preinstallation data may begin. • Monitoring with Levelogger® devices will continue throughout 2014, after installation of bio-swales has been completed. • Post-installation analysis will be compared to pre-installation data to assess the project’s efficacy. Coliform Sampling • Samples of E. coli were taken on three separate dates from July to August. • Nine tributaries chosen to monitor regions loading the most E. coli into Plaster Creek. • Suburban • Healthy Ravine / Suburban • Commercial • Industrial • Agricultural Figure 3. A map of the Plaster Creek Watershed with the nine assigned tributaries for E. coli sampling labeled according to the corresponding land use of their sub-watersheds. • Samples were taken from both the creek and tributary at each site. • These samples were plated in Coliscan EasyGel. • Data was converted to colony-forming units per 100mL of creek water. Coliform Sampling From initial levels of coliform bacteria observed in the southern portion of the watershed and the land use patterns of the Plaster Creek Watershed, we have determined that most of the E. coli introduced to the creek appeared to be from areas of heavy agriculture. Creek Channel Tributaries 800 700 600 500 E. coli (CFU/100mL) Introduction 400 300 200 100 0 Suburban - 1 Suburban - 2 Healthy Ravine - 3 Commercial - 4 Industrial - 5 Industrial - 6 Agricultural - 7 Agricultural - 8 Agricultural - 9 Location Figure 4. Comparison of the average of three E. coli samplings for nine tributaries of Plaster Creek and their accompanying downstream reaches in the main creek channel with standard error bars. Discussion Coliform Sampling Although dangerously high throughout the main channel, E. coli levels in Plaster Creek seemed to concentrate in the southern, upstream portion of the creek. The land usage of this region suggests an agricultural source of E. coli. Although determining the source of the bacteria requires further analysis. However, the geographic information of this study provides Plaster Creek Stewards with preliminary information, helping them consider the best ways to address the residents of the area as they devise best management practices for the area. Special Thanks Mike Ryskamp (Plaster Creek Stewards) Joe Rathbun, Chad Kotke, Dana Strouse (Michigan DEQ) Randall DeJong PhD (Calvin College) Scott Jones, (Former Calvin College Biology student)


