GPGPU acceleration of ISR plasma line analysis and Nathaniel J. Hilliard
advertisement

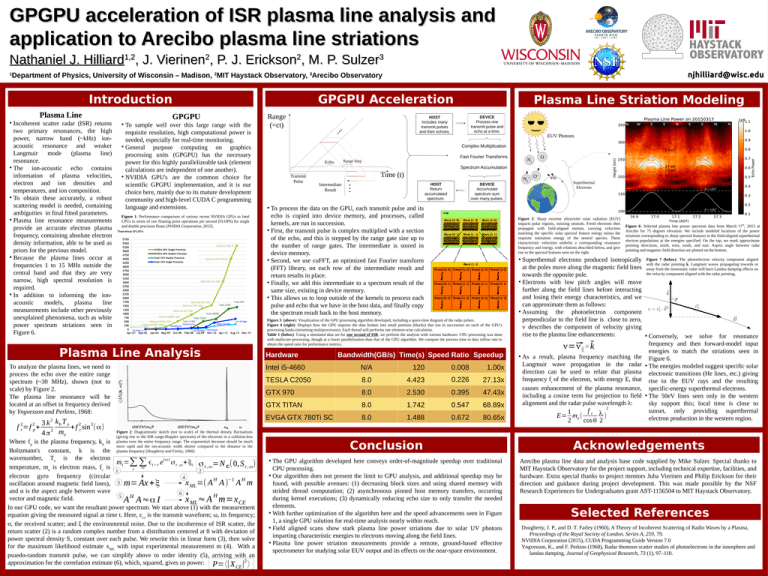
GPGPU acceleration of ISR plasma line analysis and application to Arecibo plasma line striations Nathaniel J. Hilliard , J. Vierinen , P. J. Erickson , M. P. Sulzer 1,2 2 2 3 njhilliard@wisc.edu Department of Physics, University of Wisconsin – Madison, 2MIT Haystack Observatory, 3Arecibo Observatory 1 Introduction Plasma Line Incoherent scatter radar (ISR) returns two primary resonances, the high power, narrow band (~kHz) ionacoustic resonance and weaker Langmuir mode (plasma line) resonance. The ion-acoustic echo contains information of plasma velocities, electron and ion densities and temperatures, and ion composition. To obtain these accurately, a robust scattering model is needed, containing ambiguities in final fitted parameters. Plasma line resonance measurements provide an accurate electron plasma frequency, containing absolute electron density information, able to be used as priors for the previous model. Because the plasma lines occur at frequencies 1 to 15 MHz outside the central band and that they are very narrow, high spectral resolution is required. In addition to informing the ionacoustic models, plasma line measurements include other previously unexplained phenomena, such as white power spectrum striations seen in Figure 6. s GPGPU Acceleration GPGPU To sample well over this large range with the requisite resolution, high computational power is needed, especially for real-time monitoring. General purpose computing on graphics processing units (GPGPU) has the necessary power for this highly parallelizeable task (element calculations are independent of one another). NVIDIA GPU's are the common choice for scientific GPGPU implementation, and it is our choice here, mainly due to its mature development community and high-level CUDA C programming language and extensions. Figure 1: Performance comparison of various recent NVIDIA GPUs to Intel CPUs in terms of raw floating point operations per second (FLOPS) for single and double precision floats [NVIDIA Corporation, 2015]. 3 k kb T e 2 2 f =f + 2 + f c sin ( α) 4 π me 2 ∑∑ TEMPLATE DESIGN © 2008 www.PosterPresentations.com Fast Fourier Transforms Range Step Echo CE O N2 Spectrum Accumulation Transmit Pulse Time (t) N2 + HOST Return accumulated spectrum. Intermediate Result DEVICE Accumulate spectrum sum over many pulses. To process the data on the GPU, each transmit pulse and its echo is copied into device memory, and processes, called kernels, are run in succession. ● First, the transmit pulse is complex multiplied with a section of the echo, and this is stepped by the range gate size up to the number of range gates. The intermediate is stored in device memory. ● Second, we use cuFFT, an optimized fast Fourier transform (FFT) library, on each row of the intermediate result and return results in place. ● Finally, we add this intermediate to a spectrum result of the same size, existing in device memory. ● This allows us to loop outside of the kernels to process each pulse and echo that we have in the host data, and finally copy the spectrum result back to the host memory. O+ e- e- Superthermal Electrons ● Figure 5: Sharp extreme ultraviolet solar radiation (EUV) impacts polar regions, ionizing neutrals. Freed electrons then propagate with field-aligned motion, carrying velocities matching the specific solar spectral feature energy minus the requisite ionization energy of the neutral species. These characteristic velocities underlie a corresponding resonance frequency and energy, with relations described below, and give rise to the spectral features seen on the right. Figure 6: Selected plasma line power spectrum data from March 17 th, 2015 at Arecibo for 75 degrees elevation. We include modeled locations of the power striations corresponding to sharp spectral features in the field-aligned superthermal electron populations at the energies specified. On the top, we mark approximate pointing directions, north, west, south, and east. Aspect angle between radar pointing and magnetic field direction are plotted on the bottom. Superthermal electrons produced isotropically at the poles move along the magnetic field lines towards the opposite pole. ● Electrons with low pitch angles will move further along the field lines before interacting and losing their energy characteristics, and we can approximate them as follows: ● Assuming the photoelectron component perpendicular to the field line is close to zero, v describes the component of velocity giving rise to the plasma line enhancements: ● Bandwidth(GB/s) Time(s) Speed Ratio Speedup Intel i5-4660 N/A 120 0.008 1.00x TESLA C2050 8.0 4.423 0.226 27.13x GTX 970 8.0 2.530 0.395 47.43x GTX TITAN 8.0 1.742 0.547 68.89x EVGA GTX 780Ti SC 8.0 1.488 0.672 80.65x Figure 2: Diagrammatic sketch (not to scale) of the thermal density fluctuations (giving rise to the ISR range-Doppler spectrum) of the electrons in a collision-less plasma over the entire frequency range. The exponential decrease should be much more rapid and the ion-acoustic width shorter compared to the distance to the plasma frequency [Dougherty and Farley, 1960]. Where fp is the plasma frequency, kb is Boltzmann's constant, k is the wavenumber, Te is the electron iωt mt = ϵ t−r e σ r ,ω + ξt σ =N (0, S ) r,ω ℂ r,ω ω temperature, me is electron mass, fc is r 1 2 electron gyro frequency (circular 4 H −1 H 3 x ML =( A A ) A m oscillation around magnetic field lines), m= Ax + ξ and α is the aspect angle between wave 6 H 5 H vector and magnetic field. x ML ≈ A m=x CE A A≈α I In our GPU code, we want the resultant power spectrum. We start above (1) with the measurement equation giving the measured signal at time t. Here, εt-r is the transmit waveform; ω, its frequency; σ, the received scatter; and ξ the environmental noise. Due to the incoherence of ISR scatter, the return scatter (2) is a random complex number from a distribution centered at 0 with deviation of power spectral density S, constant over each pulse. We rewrite this in linear form (3), then solve for the maximum likelihood estimate xML with input experimental measurement m (4). With a psuedo-random transmit pulse, we can simplify above to order identity (5), arriving with an approximation for the correlation estimate (6), which, squared, gives us power: P=⟨|X |2 ⟩ EUV Photons Complex Multiplication Hardware To analyze the plasma lines, we need to process the echo over the entire range spectrum (~30 MHz), shown (not to scale) by Figure 2.ure The plasma line resonance will be located at an offset in frequency derived by Yngvesson and Perkins, 1968: 2 p DEVICE Process one transmit pulse and echo at a time. HOST Includes many transmit pulses and their echoes. Figure 3 (above): Visualization of the GPU processing algorithm developed, including a space-time diagram of the radar pulses. Figure 4 (right): Displays how the GPU requires the data broken into small portions (blocks) that run in succession on each of the GPU's processing banks (streaming multiprocessors). Each thread will performs one element-wise calculation. Table 1 (below): Using a simulated data set for one second of ISR, we perform the analysis with various hardware. CPU processing was done with multicore processing, though at a lower parallelization than that of the GPU algorithm. We compare the process time to data inflow rate to obtain the speed ratio for performance metrics. Plasma Line Analysis 2 r Range (=ct) Plasma Line Striation Modeling ν=⃗ ν ∥ ∘ ⃗k ● As a result, plasma frequency matching the Langmuir wave propagation in the radar direction can be used to relate that plasma frequency fr of the electron, with energy E, that causes enhancement of the plasma resonance, including a cosine term for projection to field alignment and the radar pulse wavelength λ: 2 fr λ 1 E= m e ( ) 2 cos θ 2 Figure 7 (below): The photoelectron velocity component aligned with the radar pointing k. Langmuir waves propagating towards or away from the monostatic radar will have Landau damping effects on the velocity component aligned with the radar pointing,. Conversely, we solve for resonance frequency and then forward-model input energies to match the striations seen in Figure 6. ● The energies modeled suggest specific solar electronic transitions (He lines, etc.) giving rise to the EUV rays and the resulting specific-energy superthermal electrons. ● The 50eV lines seen only in the western sky support this; local time is close to sunset, only providing superthermal electron production in the western region. ● Conclusion Acknowledgements The GPU algorithm developed here conveys order-of-magnitude speedup over traditional CPU processing. ● Our algorithm does not present the limit to GPU analysis, and additional speedup may be found, with possible avenues: (1) decreasing block sizes and using shared memory with strided thread computation; (2) asynchronous pinned host memory transfers, occurring during kernel executions; (3) dynamically reducing echo size to only transfer the needed elements. ● With further optimization of the algorithm here and the speed advancements seen in Figure 1, a single GPU solution for real-time analysis nearly within reach. ● Field aligned scans show stark plasma line power striations due to solar UV photons imparting characteristic energies to electrons moving along the field lines. ● Plasma line power striation measurements provide a remote, ground-based effective spectrometer for studying solar EUV output and its effects on the near-space environment. Arecibo plasma line data and analysis base code supplied by Mike Sulzer. Special thanks to MIT Haystack Observatory for the project support, including technical expertise, facilities, and hardware. Extra special thanks to project mentors Juha Vierinen and Philip Erickson for their direction and guidance during project development. This was made possible by the NSF Research Experiences for Undergraduates grant AST-1156504 to MIT Haystack Observatory. ● Selected References Dougherty, J. P., and D. T. Farley (1960), A Theory of Incoherent Scattering of Radio Waves by a Plasma, Proceedings of the Royal Society of London. Series A, 259, 79. NVIDIA Corporation (2015), CUDA Programming Guide Version 7.0 Yngvesson, K., and F. Perkins (1968), Radar thomson scatter studies of photoelectrons in the ionosphere and landau damping, Journal of Geophysical Research, 73 (1), 97–110.


