7.7 Statistical Measures, 7.7 Statistical Measures, Variance
advertisement

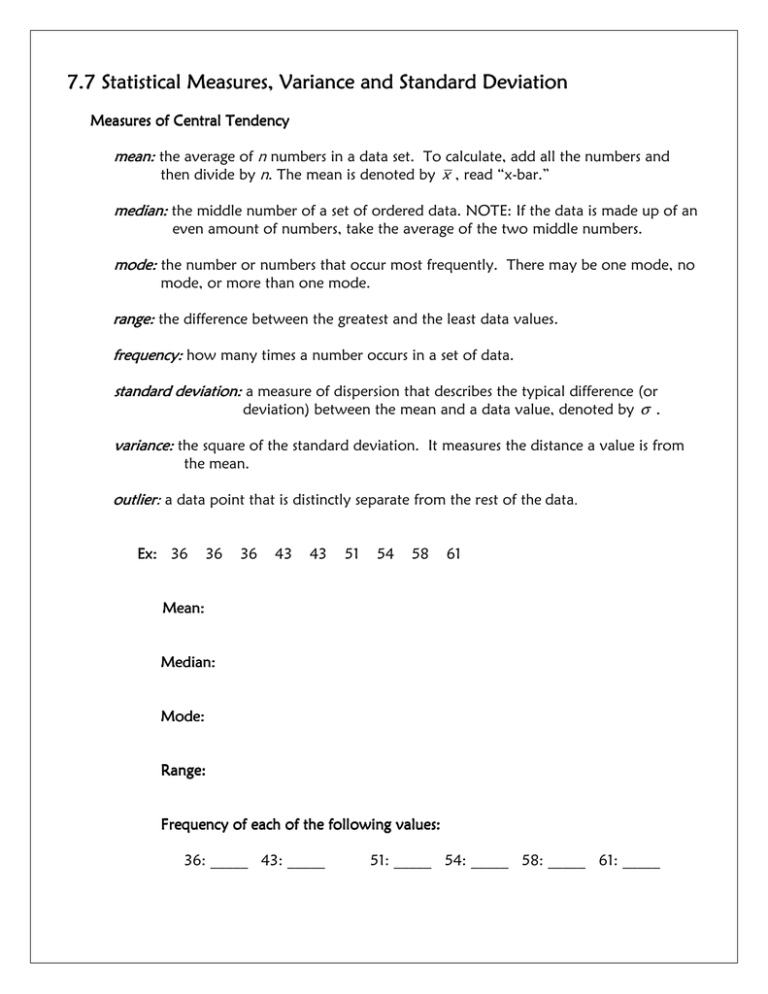
7.7 Statistical Measures, Variance and Standard Deviation Measures of Central Tendency mean: the average of n numbers in a data set. To calculate, add all the numbers and then divide by n. The mean is denoted by x , read “x-bar.” media edian: n: the middle number of a set of ordered data. NOTE: If the data is made up of an even amount of numbers, take the average of the two middle numbers. mode ode:: the number or numbers that occur most frequently. There may be one mode, no mode, or more than one mode. range: the difference between the greatest and the least data values. frequency: how many times a number occurs in a set of data. standard deviation: eviation: a measure of dispersion that describes the typical difference (or deviation) between the mean and a data value, denoted by σ . variance: the square of the standard deviation. It measures the distance a value is from the mean. outlier utlier: a data point that is distinctly separate from the rest of the data. Ex: Ex: 36 36 36 43 43 51 54 58 61 Mean: Median: Mode: Range: Frequency of each of the following values: values: 36: _____ 43: _____ 51: _____ 54: _____ 58: _____ 61: _____ Ex: Ex: Debbie has the following scores on five math tests: 88 84 80 90 84 What score must she get on the sixth test in order for her average to fall between 85 and 87? Ex: Ex: Bob was absent and made up his test but did not study for it. He scored a 38. Which measure of central tendency is most greatly affected by his score? Ex: Ex: 90 80 75 85 85 92 100 65 73 85 65 50 Mean: Median: Mode: Range: Frequency of each of the following values: 100 = ______ 85 = _______ 65 = _______ 93 = ______ Ex: Ex: Jason has the following test grades: 85 82 83 86 89 Find the variance and standard deviation of Jason’s scores. Test Scores Mean Scores – Mean (Scores – Mean)2 82 83 85 86 89 Variance: Standard Deviation= Ex: Ex: Layla has the following test grades: 82 94 75 94 85 Find the variance and standard deviation of Layla’s scores. Test Scores Mean Scores – Mean 75 82 85 94 94 Variance: Standard Deviation= (Scores – Mean)2 All of these values can be easily calculated with a graphing calculator!! STAT EDIT 1: Edit Enter data from list into L1. 2 QUIT nd STAT CALC 1: 1-Var Stats ENTER X = mean of data ∑ x = sum of all the scores x = standard deviation n = # number of pieces of data in your list min X = minimum score Q1 = 1st quartile value (we will use this to make box-and-whisker plots) Med = median score Q3 = 3rd quartile value (we will use this to make box-and-whisker plots) max X = maximum score σ *** You can order the data from smallest to largest or largest to smallest by: STAT 2: Sort A( OR 3: Sort D( (A means smallest to largest and D means largest to smallest) 2nd L1 ENTER This will help you see which data value would be your mode and also the frequency of each data value. Range can be found by subtracting max X – min X. Variance can be found by taking the standard deviation and squaring it.


