Limitation of Mammography Latest Advances in Digital Breast Tomosynthesis
advertisement

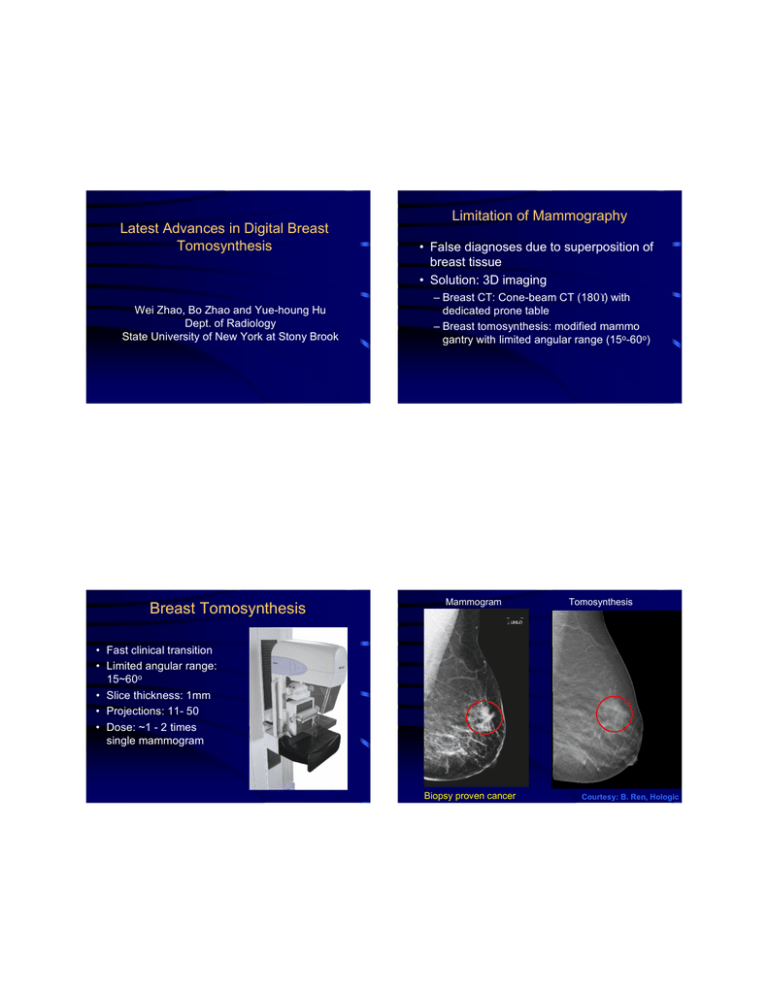
Latest Advances in Digital Breast Tomosynthesis Wei Zhao, Bo Zhao and Yue-houng Hu Dept. of Radiology State University of New York at Stony Brook Breast Tomosynthesis Limitation of Mammography • False diagnoses due to superposition of breast tissue • Solution: 3D imaging – Breast CT: Cone-beam CT (180°) with dedicated prone table – Breast tomosynthesis: modified mammo gantry with limited angular range (15o-60o) Mammogram Tomosynthesis • Fast clinical transition • Limited angular range: 15~60o • Slice thickness: 1mm • Projections: 11- 50 • Dose: ~1 - 2 times single mammogram Biopsy proven cancer Courtesy: B. Ren, Hologic Different DBT Design Company System param. Views Detector Scan time (s) Recon. GE ±20°, step/shoot (MGH, Sunnybrook) 15 CsI/a-Si 100 um 15-23 MLEM SART ±30°, step/shoot (U. of Michigan) 21 7s SART Hologic ±7.5, continuous Multiple sites 11 a-Se, 70 um 2x2 binning 10 FBP Siemens ±22°, step/shoot Duke,Malmo,SUNY 25 a-Se, 85 um 12.5/20 Bin/full FBP Dexela ±12-20° (U. of Virginia) 13 Fiber optic coupled CCD 30 s MLEM X-counter ±13° 48 Gas counting, 48 slit, 60 um Sectra ±5.5º, 6-site trial 21 Si counting, 21 slit, 50 um FBP iterative 3-8 s Factors Affecting Image Quality • Detector performance – DQE at low dose: 1/NView – Temporal performance: lag and ghosting • Imaging geometry – Angular range, number of views – Focal spot blur: continuous tube travel • Reconstruction algorithm – Analytical: FBP (filter design) – Iterative Imaging Geometry: spatial vs. frequency domain Detector Performance 0.8 data-line direction nbin bin 0.7 fz 0.43 mR 2.15 mR 6.01 mR 0.6 0.5 DQE dz Reconstructed slices dx d y voxel space c overed by ac quired im ages rec tangular area (fzNY,fx NY) used for reconstruction 0.4 θ fz NY fx z 0.3 fx y NY 0.2 x 0.1 0.0 0 1 2 3 4 spatial frequency (cycles/mm) 5 6 Frequency domain B. Zhao and W. Zhao, Med. Phys. 2008 Spatial domain 3D Image quality metrics: MTF, NPS and DQE Noise Measurement Focal spot fz fz 4cm Lucite 2fNY 2fNY Aliasing dz dx voxel fNY fx Reconstructed 3d image fx Θ z 40 slices dy 3D FFT y x Slice thickness 1 mm: Noise aliasing in z Projection noise image Slice thickness filter: eliminate aliasing Voxel dimension dx=0.085 mm dy=0.085 mm dz=1 mm detector B. Zhao et. al, Med. Phys. 2009 NPS vs. angular dose distribution In-depth NPS fz measurement fy experiment model fx ADS-1 SBP ADS-2 Ramp x Hann ( 2fNY Ramp x Hann x ST (width =0.47cycles/mm) fz ADS-3 model ADS-1 fx •Effect of angular range •Effect of reconstruction filters •Effect of 3D sampling, ST filter ADS-2 fz fx ADS-3 3D NPS In-plane NPS avg NPS NPS of top slice NPS from model 60000 Projection 2D NPS fy fx 50000 calculated 2D avg NPS 2 40000 2 Measured 2D avg NPS from all slices NPS(ADU mm ) Measured 2D NPS from top slice 30000 20000 fy 10000 fx 0 •Reconstruction: Ramp + Hanning -6 -4 -2 0 2 4 6 freq(cycles/mm) Oversampled Point Spread Function (PSF) PSF/artifact vs. Angular Range x (mm) y z z 0 x y 70 um wire tilted 20 degrees 17 (mm) 0 14 +20o +15o +10o +5o MTF – Dependence on Filters Impact of Angular Range on In-Plane MTF x (cyc/mm) SBP 3.0 angular range o 10 o 20 o 40 o 60 o 180 2.5 z RA MTF 2.0 RA+SA 1.5 1.0 0.5 0 RA+SA+ST 0.0 0 2 4 freq(cycles/mm) 0.5 cyc/mm 0 10 • Increasing angular range improves MTF at low frequencies In-Plane MTF In-Plane MTF Measurement Projection 2D MTF 1.0 Focal spot 4000 fy 3500 Measurement Model recon setting: Rampx Hann xST, prebin 0.8 3000 fx 2000 1500 In-plane MTF 1000 0.6 MTF ESF 2500 Reconstructed in-plane im age 0.4 500 0 20 40 60 80 100 120 140 160 180 200 position(pixel) 0.2 Derivative(LSF) 0.0 0 2 4 6 8 freq(cycles/mm) Edge phantom |1D FFT|: MTFx 2cm lucite Low f drop caused by ramp filter and limited angular range detector Edge phantom: 0.2mm Al High f drop caused by other reconstruction filters 10 Dependence on Angular Range Reconstruction filter designs 2.0 • Ramp + limited angle: loss of low frequency (breast density) • Modified filters: recovers density, but increased out-of-plane blur • Iterative recon: improvement at the cost of computation ±10o SDNR=2.5 SDNR=1.4 ramp 1.5 amplitude ±20o Slice thickness (fz) 1.0 Polynomial, similar to SART apodization 0.5 0.0 0 1 2 3 4 Spatial frequency (cycles/mm) ACR phantom imaged at 28kVp, W/Rh, 1.7mGy J. Zhou et. al. Med. Phys. 2007; Ludwig et. al. IWDM2008; B. Ren, et. al. SPIE 2009 Recon: FBP with ST filter Reconstruction filter comparison Clinical Application of DBT • Screening/diagnosis • Contrast enhancement: angiogenesis • Multimodality imaging: – DBT + automated ultrasound (AUS) • P. Carson et. al. U. Michigan – DBT + optical tomography • Boas et. al. MGH – DBT + limited angle SPECT FBP with Ramp SIRT Adapted from Ludwig et. al. (IWDM 2008) Polynomial • M. Williams et. al., U. Virginia 5 6 Dynamic Contrast-Enhanced (CE) Tomosynthesis p19_scout_enhan3 p19_scout_enhan3 Pre X-ray projections CE-Tomosynthesis Post Post Pre - Tomo reconstruction = Mammo 2 Signal mg/cm Tomo CE-Tomo Kinetics 3 2 1 0 0 2 4 6 8 Time (minutes) Subtraction (CE) Courtesy Dr. R. Jong Courtesy M. Hill and J. Mainprize Case 1: poorly differentiated invasive ductal carcinoma Temporal vs. Dual-Energy CE-DBT • DS DBT system, GE Medical Systems • Automated tube motion • No anti-scatter grid • HE: – Rh target - 0.25 mm Rh + 0.25 mm Cu filter – 49 kVp • LE – Rh target – 0.25 mm Rh filter – 32 kV • 7 projections: 40° arc, 6.7° apart • Dose per HE/LE data set ~single mammographic view (~2 mGy) • Filtered backprojection Courtesy Ann-Katherine Carton Courtesy Ann-Katherine Carton Carton A.-K., Chen. et al., Br. J. Rad. 2010 U. Michigan Automated US Scanning System GE Gen II Research Tomo Unit 60o angle 21 projections 7.5 sec GE Logiq 9 US system US transducer xy translator Dual-modality compression paddle TPX paddle • Translator & transducer are flipped up out of field for tomo acquisition Stationary digital x-ray detector • Translator & transducer flipped down for AUS acquisition Courtesy: Drs. P. Carson and M. Goodsitt Courtesy: Drs. P. Carson and M. Goodsitt Co-location Reader Study Display GUI showing Corresponding VOI’s in DBT & AUS Invasive Cancer mammo • tomo AUS-suggested ductal extension Courtesy: Drs. Carson & Goodsitt AUS New detectors: Improve low dose performance Further Development for DBT Systems x-rays x-rays • Gantry: HV bias electrode O L – Faster scan, more views O N T R Structured CsI MU LT IPLE IN G - C - R O L T O N N C S XER G D S C A N IN G N A N – dual-energy, shorter pulse/less focal spot blur High gain photoconductor S C • Generator/tube: storage capacitor Avalanche TFT a-Se (HARP) pixel electrode S MULT G D IP LE XE R storage capacitor TFT pixel electrode • Detector: – Better low dose performance, faster readout – photon-counting Summary • Physics of DBT: 2D 3D – Optimization of acquisition and recon. • New clinical applications: – Contrast enhanced CEDBT – Multimodality imaging • Challenges for further system development Direct FPI: Photoconductor with higher gain Indirect FPI: Avalanche photodetector Acknowledgements • Financial support: – Siemens AG – Army Breast Cancer Research Program – NIH • Contributing slides: – Drs. Baorui Ren, James Mainprize, Mitch Goodsitt, Ann-Katherine Carton, Mats Danielsson


