Name: Date: Scatterplot Take Home Quiz – 15 Points
advertisement

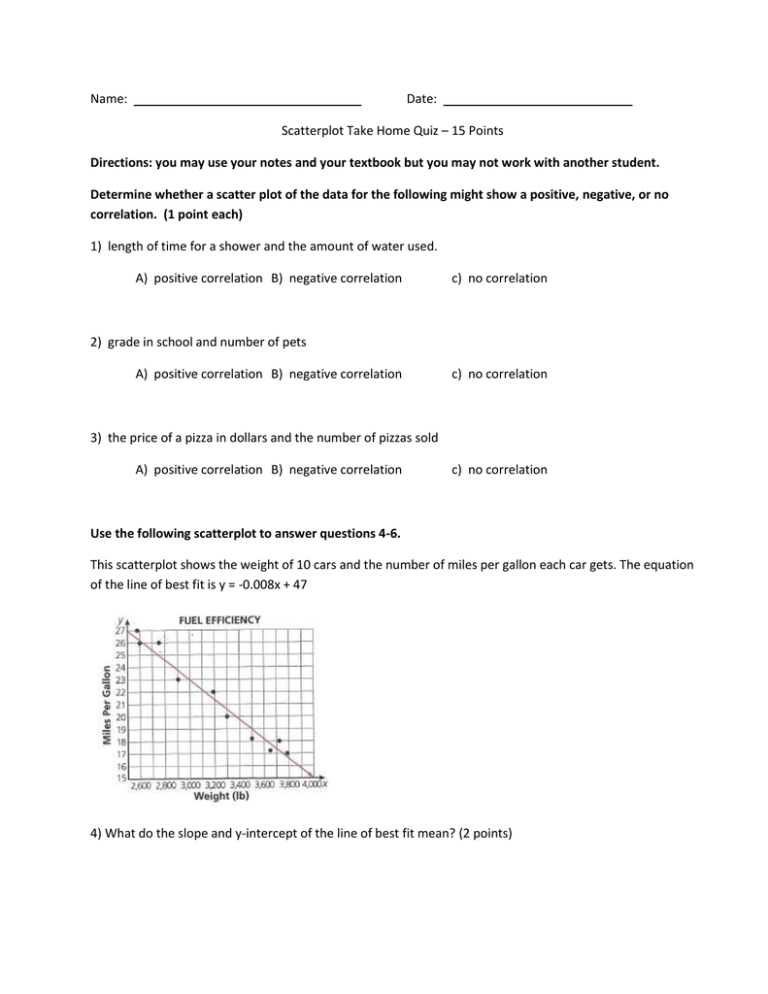
Name: Date: Scatterplot Take Home Quiz – 15 Points Directions: you may use your notes and your textbook but you may not work with another student. Determine whether a scatter plot of the data for the following might show a positive, negative, or no correlation. (1 point each) 1) length of time for a shower and the amount of water used. A) positive correlation B) negative correlation c) no correlation 2) grade in school and number of pets A) positive correlation B) negative correlation c) no correlation 3) the price of a pizza in dollars and the number of pizzas sold A) positive correlation B) negative correlation c) no correlation Use the following scatterplot to answer questions 4-6. This scatterplot shows the weight of 10 cars and the number of miles per gallon each car gets. The equation of the line of best fit is y = -0.008x + 47 4) What do the slope and y-intercept of the line of best fit mean? (2 points) 5) If a car weighs 3000 pounds, how many miles per gallon does it get? (1 point) 6) If a car gets 18 miles per gallon, how much does it weigh to the nearest pound? (1 point) 7) This scatter plot shows the relationship between the number of times a baseball player was at bat and the number of hits the player made during 10 seasons played. If this baseball player is at bat 250 times in the next season, what would be the expected number of hits the player makes? (1 point) A. 40 B. 50 C. 70 D. 90 8) The scatterplot shows the study times and test scores for a number of students. Which of the following statements relation to the scatter plot is true? 1pt A) As study time increased, test scores increased. B) As study time increased, test scores decreased. C) As test scores increased, study time decreased. 9) Write an equation for the line of best fit for the following graph. (3 points) equation - 10) This scatter plot shows the relationship between the number of people in each group dining at a restaurant and the total amount of their dinner bill. Draw a trend line on the scatter plot above that best fits the data points. (1 point) 11) Gayle used the equation y = 20x to predict the total dinner bill for a group of 6 people. Use your trend line to explain whether or not this equation is a good fit for the data in the scatter plot. (2 points)


