College of San Mateo Program Review
advertisement
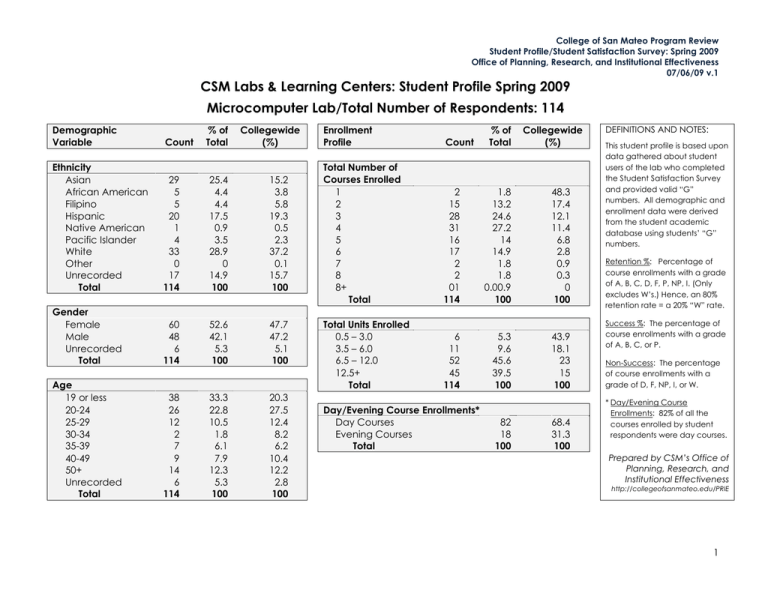
College of San Mateo Program Review Student Profile/Student Satisfaction Survey: Spring 2009 Office of Planning, Research, and Institutional Effectiveness 07/06/09 v.1 CSM Labs & Learning Centers: Student Profile Spring 2009 Microcomputer Lab/Total Number of Respondents: 114 Demographic Variable Count % of Total Collegewide (%) Ethnicity Asian African American Filipino Hispanic Native American Pacific Islander White Other Unrecorded Total 29 5 5 20 1 4 33 0 17 114 25.4 4.4 4.4 17.5 0.9 3.5 28.9 0 14.9 100 15.2 3.8 5.8 19.3 0.5 2.3 37.2 0.1 15.7 100 Gender Female Male Unrecorded Total 60 48 6 114 52.6 42.1 5.3 100 47.7 47.2 5.1 100 Age 19 or less 20-24 25-29 30-34 35-39 40-49 50+ Unrecorded Total 38 26 12 2 7 9 14 6 114 33.3 22.8 10.5 1.8 6.1 7.9 12.3 5.3 100 20.3 27.5 12.4 8.2 6.2 10.4 12.2 2.8 100 Enrollment Profile Count Total Number of Courses Enrolled 1 2 3 4 5 6 7 8 8+ Total 2 15 28 31 16 17 2 2 01 114 1.8 13.2 24.6 27.2 14 14.9 1.8 1.8 0.00.9 100 48.3 17.4 12.1 11.4 6.8 2.8 0.9 0.3 0 100 Total Units Enrolled 0.5 – 3.0 3.5 – 6.0 6.5 – 12.0 12.5+ Total 6 11 52 45 114 5.3 9.6 45.6 39.5 100 43.9 18.1 23 15 100 Day/Evening Course Enrollments* Day Courses Evening Courses Total % of Total 82 18 100 Collegewide (%) 68.4 31.3 100 DEFINITIONS AND NOTES: This student profile is based upon data gathered about student users of the lab who completed the Student Satisfaction Survey and provided valid “G” numbers. All demographic and enrollment data were derived from the student academic database using students’ “G” numbers. Retention %: Percentage of course enrollments with a grade of A, B, C, D, F, P, NP, I. (Only excludes W’s.) Hence, an 80% retention rate = a 20% “W” rate. Success %: The percentage of course enrollments with a grade of A, B, C, or P. Non-Success: The percentage of course enrollments with a grade of D, F, NP, I, or W. * Day/Evening Course Enrollments: 82% of all the courses enrolled by student respondents were day courses. Prepared by CSM’s Office of Planning, Research, and Institutional Effectiveness http://collegeofsanmateo.edu/PRIE 1 College of San Mateo Program Review Student Profile/Student Satisfaction Survey: Spring 2009 Office of Planning, Research, and Institutional Effectiveness 07/06/09 v.1 CSM Labs & Learning Centers: Student Profile Spring 2009 Microcomputer Lab/Total Number of Respondents: 114 Demographic Variable Count Column % 113 24.5 98 15 105 86.7 13.3 92.9 73.7 26.3 83.9 23 18 83 5 3.9 18 20 14 62 3 4 21 22 15 71 87 77.8 74.7 13 22.2 25.3 95.7 83.3 85.5 57.8 67.4 67.4 42.2 32.6 38.4 80 80.3 78.4 Respondent Count Respondent Percentage Success Non-success Retention Success Non-success Retention Collegewide Percentage Success Non-success Retention Ethnicity Asian African American Filipino Hispanic Native American Pacific Islander White Other Unrecorded Total 2 0.4 2 0 2 100 0 100 64.8 35.2 82.4 18 138 0 67 462 3.9 29.9 0 14.5 100 16 114 0 50 376 2 24 0 17 86 18 126 0 61 420 88.9 82.6 0 74.6 81.4 11.1 17.4 0 25.4 18.6 100 91.3 0 91 90.9 60.3 71.5 73.7 70.9 68.5 39.7 28.5 26.3 29.1 31.5 80.6 83.6 89.5 83.8 82.2 Gender Female Male Unrecorded Total 246 189 27 462 53.2 40.9 5.8 100 204 150 22 376 42 39 5 86 225 170 25 420 82.9 79.4 81.5 81.4 17.1 20.6 20.6 18.6 91.5 89.9 92.6 90.9 70.2 66.2 74.5 68.5 29.8 33.8 25.5 31.5 82.9 81 85.5 82.2 Age 19 or less 20-24 25-29 30-34 35-39 40-49 50+ Unrecorded Total 148 116 61 7 24 29 50 27 462 32 25.1 13.2 1.5 5.2 6.3 10.8 5.8 100 125 88 50 6 20 27 38 22 376 23 28 11 1 4 2 12 5 86 138 102 53 6 22 28 46 25 420 84.5 75.9 82 85.7 83.3 93.1 76 81.5 81.4 15.5 24.1 18 14.3 16.7 6.9 24 18.5 18.6 93.2 87.9 86.9 85.7 91.7 96.6 92 92.6 90.9 64.6 64 69.7 72.8 73.1 77.7 80 79.3 68.5 35.4 36 30.3 27.2 26.9 22.3 20 20.7 31.5 81.5 79.4 81.5 82.6 83.1 87.7 88.1 88.4 82.2 2 College of San Mateo Program Review Student Profile/Student Satisfaction Survey: Spring 2009 Office of Planning, Research, and Institutional Effectiveness 07/06/09 v.1 CSM Labs & Learning Centers: Student Profile Spring 2009 Microcomputer Lab Course Enrollments: Top 25 Courses Sorted by Greatest Enrollment Course BUS. 295 BUS. 315 MATH 200 ACTG 121 ECON 100 ECON 102 PSYC 100 SPCH 100 ACTG 145 HSCI 100 BUSW 105 ACTG 131 ENGL 110 Title Computer Systems in Business Keyboarding I Elem. Probability & Statistics Financial Accounting Principles of Macro Economics Principles of Micro Economics General Psychology Public Speaking QuickBooksPayroll/Merchndising General Health Science Intro Microcomputers XP/2007 Managerial Accounting Compos., Lit. & Crit. Thinking Count Percent 28 24.6 17 14.9 13 11.4 13 11.4 10 8.8 10 8.8 9 7.9 9 7.9 9 7.9 8 7.0 8 7.0 8 7.0 7 6.1 Course ACTG 144 ENGL 100 BUSW 416 MATH 125 CRER 127 BUSW 415 BUSW 215 CRER 121 MATH 120 MATH 811 FITN 334 BUS. 317 Title Count Percent QuickBooks Set‐up/Service Bus. 7 6.1 Composition and Reading 7 6.1 Spreadsheet II Vista 2007 7 6.1 Elementary Finite Mathematics 7 6.1 Career Choices II: Job Search 6 5.3 Spreadsheet I Vista 2007 6 5.3 WP II WORD for Windows Vista07 6 5.3 Planning for Student Success 6 5.3 Intermediate Algebra 5 4.4 Arithmetic Review 5 4.4 Yoga 5 4.4 Micro/Keyboarding: Skillbldg 5 4.4 NOTE: This student profile is based upon data gathered about the student users of the lab who completed the Student Satisfaction Survey and provided correct “G” numbers. 3 College of San Mateo Program Review Student Profile/Student Satisfaction Survey: Spring 2009 Office of Planning, Research, and Institutional Effectiveness 07/06/09 v.1 CSM Labs & Learning Centers: Student Profile Spring 2009 Microcomputer Lab Course Enrollments: Sorted by Discipline Area Dept. Course ACTG ACTG 121 ACTG 145 ACTG 131 ACTG 144 ACTG 100 ACTG 103 ACTG 161 ASTR ASTR 101 BIOL BIOL 100 BIOL 250 BIOL 130 BUS. BUS. 295 BUS. 315 BUS. 317 BUS. 201 BUS. 401 BUS. 100 BUSW BUSW 105 BUSW 416 BUSW 415 BUSW 215 BUSW 214 BUSW 383 Title Count Percent Financial Accounting 13 11.4 QuickBooksPayroll/Merchndising 9 7.9 Managerial Accounting 8 7.0 QuickBooks Set‐up/Service Bus. 7 6.1 Accounting Procedures 5 4.4 Ten‐Key Skills 4 3.5 Intermediate Accounting I 2 1.8 Astronomy Laboratory 2 1.8 Intro to the Life Sciences 3 2.6 Anatomy 3 2.6 Human Biology 2 1.8 Computer Systems in Business 28 24.6 Keyboarding I 17 14.9 Micro/Keyboarding: Skillbldg 5 4.4 Business Law I 3 2.6 Business Communications 3 2.6 Contemporary American Business 2 1.8 Intro Microcomputers XP/2007 8 7.0 Spreadsheet II Vista 2007 7 6.1 Spreadsheet I Vista 2007 6 5.3 WP II WORD for Windows Vista07 6 5.3 WP I WORD for Windows Vista 07 3 2.6 Bus Pres PwrPt I Vista 07 3 2.6 Dept. Course BUSW 384 BUSW 114 CHEM CHEM 192 CHIN CHIN 112 CIS CIS 110 CRER CRER 127 CRER 121 CRER 122 CRER 120 CRER 126 DANC DANC 132 DANC 143 ECON ECON 100 ECON 102 ENGL ENGL 110 ENGL 100 ENGL 828 ENGL 848 ESL ESL 400 ESL 828 ESL 849 ESL 848 ESL 850 ETHN ETHN 300 Title Bus Pres PwrPt II Vista 07 Windows Fundamentals I ‐ Vista Elementary Chemistry Elementary Chinese II Introduction to CIS Career Choices II: Job Search Planning for Student Success Strategies for Educ. Success Life and Career Planning Career Choices I: Assessment Jazz Dance II Intermediate Ballet II Principles of Macro Economics Principles of Micro Economics Compos., Lit. & Crit. Thinking Composition and Reading Basic Composition and Reading Intro to Comp and Reading Comp For Non‐Native Speakers Writing Non‐Native Speakers IV Conversation Workshop Conversation N/N Speakers IV Writing Workshop Introduction to LaRaza Studies Count Percent 2 1.8 2 1.8 2 1.8 2 1.8 2 1.8 6 5.3 6 5.3 4 3.5 3 2.6 2 1.8 2 1.8 2 1.8 10 8.8 10 8.8 7 6.1 7 6.1 5 4.4 2 1.8 4 3.5 3 2.6 2 1.8 2 1.8 2 1.8 3 2.6 4 College of San Mateo Program Review Student Profile/Student Satisfaction Survey: Spring 2009 Office of Planning, Research, and Institutional Effectiveness 07/06/09 v.1 Dept. Course ETHN 360 FITN FITN 334 FITN 301 FITN 680MC FITN 205 FITN 195 FITN 335 FITN 237 HIST HIST 102 HIST 201 HIST 202 HSCI HSCI 100 ITAL ITAL 111 MATH MATH 200 MATH 125 MATH 120 MATH 811 MATH 241 MATH 111 MATH 252 Title People & Culture of Polynesia Yoga Spinning Yoga ‐ Dahn Style Weight Conditioning Fitness Lab Pilates Total Core Training History American Civ United States History I United States History II General Health Science Elementary Italian I Elem. Probability & Statistics Elementary Finite Mathematics Intermediate Algebra Arithmetic Review Applied Calculus I Elementary Algebra I Calcu/Analytic Geometry II Count Percent 2 1.8 5 4.4 4 3.5 3 2.6 3 2.6 2 1.8 2 1.8 2 1.8 2 1.8 2 1.8 2 1.8 8 7.0 2 1.8 13 11.4 7 6.1 5 4.4 5 4.4 5 4.4 2 1.8 2 1.8 Dept. Course MATH 123 MATH 122 MATH 251 MUS. MUS. 202 MUS. 371 MUS. 100 OCEN OCEN 100 P.E. P.E. 120 PHIL PHIL 100 PLSC PLSC 210 PLSC 310 PLSC 200 PSYC PSYC 100 PSYC 110 READ READ 830 READ 825 SOCI SOCI 105 SPCH SPCH 100 SPCH 120 TEAM TEAM 148 Title Intermediate Algebra II Intermediate Algebra I Calcu/Analytic Geometry I Music Listening and Enjoyment Guitar I Fundamentals of Music Oceanography First Aid/CPR Introduction to Philosophy American Politics Calif State & Local Govt National, State & Local Govt General Psychology Courtship, Marriage & Family College and Career Reading Intro to College Reading Social Problems Public Speaking Interpersonal Communication Indoor Soccer Count Percent 2 1.8 2 1.8 2 1.8 4 3.5 3 2.6 3 2.6 3 2.6 3 2.6 3 2.6 4 3.5 3 2.6 2 1.8 9 7.9 2 1.8 4 3.5 2 1.8 2 1.8 9 7.9 5 4.4 2 1.8 NOTE: This student profile is based upon data gathered about the student users of the lab who completed the Student Satisfaction Survey and provided correct “G” numbers. This listing does not include courses with fewer than 2 students enrolled. 5
