Dynamic Features and Prediction Model for Yu Sun, John M. Hollerbach
advertisement
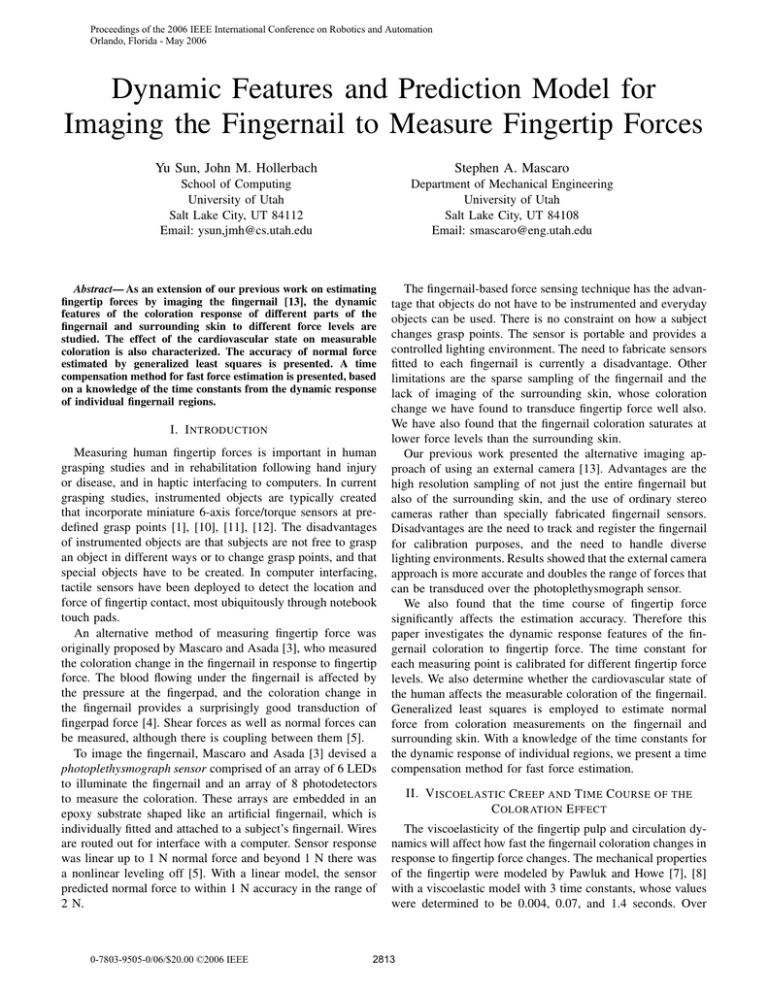
Proceedings of the 2006 IEEE International Conference on Robotics and Automation Orlando, Florida - May 2006 Dynamic Features and Prediction Model for Imaging the Fingernail to Measure Fingertip Forces Yu Sun, John M. Hollerbach Stephen A. Mascaro School of Computing University of Utah Salt Lake City, UT 84112 Email: ysun,jmh@cs.utah.edu Department of Mechanical Engineering University of Utah Salt Lake City, UT 84108 Email: smascaro@eng.utah.edu Abstract— As an extension of our previous work on estimating fingertip forces by imaging the fingernail [13], the dynamic features of the coloration response of different parts of the fingernail and surrounding skin to different force levels are studied. The effect of the cardiovascular state on measurable coloration is also characterized. The accuracy of normal force estimated by generalized least squares is presented. A time compensation method for fast force estimation is presented, based on a knowledge of the time constants from the dynamic response of individual fingernail regions. I. I NTRODUCTION Measuring human fingertip forces is important in human grasping studies and in rehabilitation following hand injury or disease, and in haptic interfacing to computers. In current grasping studies, instrumented objects are typically created that incorporate miniature 6-axis force/torque sensors at predefined grasp points [1], [10], [11], [12]. The disadvantages of instrumented objects are that subjects are not free to grasp an object in different ways or to change grasp points, and that special objects have to be created. In computer interfacing, tactile sensors have been deployed to detect the location and force of fingertip contact, most ubiquitously through notebook touch pads. An alternative method of measuring fingertip force was originally proposed by Mascaro and Asada [3], who measured the coloration change in the fingernail in response to fingertip force. The blood flowing under the fingernail is affected by the pressure at the fingerpad, and the coloration change in the fingernail provides a surprisingly good transduction of fingerpad force [4]. Shear forces as well as normal forces can be measured, although there is coupling between them [5]. To image the fingernail, Mascaro and Asada [3] devised a photoplethysmograph sensor comprised of an array of 6 LEDs to illuminate the fingernail and an array of 8 photodetectors to measure the coloration. These arrays are embedded in an epoxy substrate shaped like an artificial fingernail, which is individually fitted and attached to a subject’s fingernail. Wires are routed out for interface with a computer. Sensor response was linear up to 1 N normal force and beyond 1 N there was a nonlinear leveling off [5]. With a linear model, the sensor predicted normal force to within 1 N accuracy in the range of 2 N. 0-7803-9505-0/06/$20.00 ©2006 IEEE The fingernail-based force sensing technique has the advantage that objects do not have to be instrumented and everyday objects can be used. There is no constraint on how a subject changes grasp points. The sensor is portable and provides a controlled lighting environment. The need to fabricate sensors fitted to each fingernail is currently a disadvantage. Other limitations are the sparse sampling of the fingernail and the lack of imaging of the surrounding skin, whose coloration change we have found to transduce fingertip force well also. We have also found that the fingernail coloration saturates at lower force levels than the surrounding skin. Our previous work presented the alternative imaging approach of using an external camera [13]. Advantages are the high resolution sampling of not just the entire fingernail but also of the surrounding skin, and the use of ordinary stereo cameras rather than specially fabricated fingernail sensors. Disadvantages are the need to track and register the fingernail for calibration purposes, and the need to handle diverse lighting environments. Results showed that the external camera approach is more accurate and doubles the range of forces that can be transduced over the photoplethysmograph sensor. We also found that the time course of fingertip force significantly affects the estimation accuracy. Therefore this paper investigates the dynamic response features of the fingernail coloration to fingertip force. The time constant for each measuring point is calibrated for different fingertip force levels. We also determine whether the cardiovascular state of the human affects the measurable coloration of the fingernail. Generalized least squares is employed to estimate normal force from coloration measurements on the fingernail and surrounding skin. With a knowledge of the time constants for the dynamic response of individual regions, we present a time compensation method for fast force estimation. II. V ISCOELASTIC C REEP AND T IME C OURSE OF THE C OLORATION E FFECT The viscoelasticity of the fingertip pulp and circulation dynamics will affect how fast the fingernail coloration changes in response to fingertip force changes. The mechanical properties of the fingertip were modeled by Pawluk and Howe [7], [8] with a viscoelastic model with 3 time constants, whose values were determined to be 0.004, 0.07, and 1.4 seconds. Over 2813 75% of the magnitude of the response was due to the first two fast terms, whose time constants are less than 0.1 seconds. From pulsatile pressure variation in the data, the blood flow is already restored by the time that the third term dominates. Experimental evidence from [3] showed that the time constant of the response of the blood flow is between 0.1 and 0.4 seconds, depending on which part of the fingernail is observed. Fig. 2. The step forces applied on one subject’s fingertip. 3 2.8 (A) Force (N) 2.6 (B) Fig. 1. (A) A Flea camera images the Nano 17 force sensor mounted on a Bruel & Kjal 4808 voice-coil motor. (B) A constrainer limits the finger’s movement. 2.4 2.2 2 (A) 1.8 1.6 0 0.1 0.2 0.3 0.4 0.5 0.6 0.7 0.8 0.9 1 Time (second) 0.99 0.98 0.97 Coloration An experiment was designed to study the dynamic response of individual fingertip and skin regions to different force levels. These regions were defined by fitting a triangular mesh to 3D points obtained from a stereo image of the fingernail surface [13]. This triangular mesh serves as the 3D model of the fingernail for registration and calibration purposes. A light weight 6-axis force sensor Nano 17 from ATI Industrial Automation was mounted on a Bruel & Kjal 4808 voice-coil motor (Figure 1). The motor is controlled by a PC to provide step forces through the rubber-surface flat plane on the Nano 17 force sensor. A restrainer that can be adjusted vertically and horizontally is used to limit the finger’s moverment. A Flea camera (Point Grey Research, Inc.) and a light dome are used to capture fingernail images at 30 fps synchronously with recorded forces from the Nano 17 force sensor. In the experiment, the constrainer is located on the middle phalanx, so that the constrainer does not affect the coloration change in the fingernail. An open-loop controller is designed to control the motor to apply loading and unloading step forces on the fingerpad. The forces applied on the fingerpad of one subject are shown in Figure 2. The step forces are designed to cover the whole measuring range, which is from 0 to 8 N. Since we know the dominent coloration response time of the fingernail is less than 1 second, the step force applied on the fingerpad in the experiment contains a 0.07 second jump and a 1 second hold. To avoid the saturation effect, the force step is designed to be around 1 N and a series of force steps are applied to cover different force levels. For each force step, the time constant of the coloration step response is calculated as a first order system [9]. Figure 3 shows the coloration step response of one mesh element to the step force 1.7-2.7 N. The time constant for this mesh element 0.96 0.95 (B) 0.94 0.93 0 0.1 0.2 0.3 0.4 0.5 0.6 0.7 0.8 0.9 1 Time (second) Fig. 3. (A) The force step. (B) The coloration response (B value in RGB space) of one mesh element. at this force level is 0.03 seconds. Figure 4 shows the histograms of time constants at different force levels and directions (loading or unloading) for all mesh elements for one subject. The speed of response depends on loading versus unloading, and on the force level. 1) When the force levels are larger than 2 N, the response times are the fastest for both loading and unloading. The majority of mesh elements have time constants below 0.1 seconds. 2) When the force levels are below 1 N, the time constants of most mesh elements for loading are also below 0.2 seconds. But for unloading, the mesh elements respond relatively slowly. 3) When the force level is between 1 N and 2 N, more mesh elements have larger time constants for loading as 2814 1600 2500 1400 Step Force 0 − 0.6 N 1400 Step Force 7.8 − 6.2 N Step force 0.6 − 1.7 N 1200 1200 Step Force 6.2 −4.4 N 1000 2000 1200 Number 1000 800 1000 1500 800 600 800 600 600 400 400 400 200 200 0 0 500 0.1 0.2 0.3 0.4 0.5 0.6 0.7 0.8 0.9 1 Time Constant (second) 1600 1000 Step Force 1.7 − 2.8 N 200 0 0 0.1 0.2 0.3 0.4 0.5 0.6 0.7 0.8 0.9 1 0 0 0.1 0.2 0.3 0.4 0.5 0.6 0.7 0.8 0.9 1 1500 2000 Step Force 4.4 − 3.4 N Step Force 2.7 − 4.5 N 0 0 0.1 0.2 0.3 0.4 0.5 0.6 0.7 0.8 0.9 1 2000 Step Force 3.2 − 2 N 1400 1200 1500 1500 1000 1000 800 1000 1000 600 500 400 500 500 200 0 0 0.1 0.2 0.3 0.4 0.5 0.6 0.7 0.8 0.9 1 1600 Step Force 4.5 − 6.3 0 0 0.1 0.2 0.3 0.4 0.5 0.6 0.7 0.8 0.9 1 0 0 0.1 0.2 0.3 0.4 0.5 0.6 0.7 0.8 0.9 1 1000 2000 Step Force 1.8 − 0.9 N Step Force 6.3 − 8.1 N Step Force 0.8 − 0.2 N 800 600 1500 1200 500 600 1000 400 1000 800 400 300 600 500 400 200 200 100 200 Step Force 7.7 − 8.4 N 0 0 0.1 0.2 0.3 0.4 0.5 0.6 0.7 0.8 0.9 1 0 0 0.1 0.2 0.3 0.4 0.5 0.6 0.7 0.8 0.9 1 Step Force 8.6 − 7.9 N 2000 1000 1500 800 600 1000 400 500 200 0 0 0.1 0.2 0.3 0.4 0.5 0.6 0.7 0.8 0.9 1 0 0 0.1 0.2 0.3 0.4 0.5 0.6 0.7 0.8 0.9 1 2500 1200 0 0 0.1 0.2 0.3 0.4 0.5 0.6 0.7 0.8 0.9 1 The histogram of time constants responding to different step forces well. These conclusions do not hold for all subjects. Another subject had a fast response for entire loading range and for most of the unloading range, but slow response for unloading from 4 to 2 N. So, for estimation purposes, calibration should be carried out for each subject. Limited by the dynamic features of the coloration response to force, the best use of this method is for slow force estimation. For fast force, time compensation has to be applied, which is described in section V. of ordinary vascular pulsation, we measured the pulsation using transmission photoplethysmography and monitored the fingernail coloration changes with the Flea camera. The output of the photoplethysmograph and camera were continuously and synchronously recorded for 7 to 8 seconds while a subject rested his finger on the force sensor, maintaining a constant normal force via display feedback. A time history of the photoplethysmograph is plotted in Figure 5, showing the pulsation. The normalized crosscorrelations between the photoplethysmograph and the coloration of the camera pixels are shown in Figure 6 for two different force levels. In both cases, the average crosscorrelations of all the pixels with the plethysmograph is 0.3, and no pixel correlates more than 0.5. Thus there is no evidence that the vascular pulsation affects the coloration changes in the fingernail or surrounding skin in any way that is visible to the camera system. Signal (V) 0 0 0.1 0.2 0.3 0.4 0.5 0.6 0.7 0.8 0.9 1 Fig. 4. 800 700 1400 1400 0 0 0.1 0.2 0.3 0.4 0.5 0.6 0.7 0.8 0.9 1 1 0 −1 0 III. VASCULAR P ULSATION The cardiovascular state of the human may also affect the measurable coloration of the fingernail. To determine the effect 2815 1 2 Fig. 5. 3 4 Time (second) 5 The pulse curve of one subject 6 7 4000 1 Pixel number 3000 0.8 2000 Coloration (A) 1000 0 0 0.1 0.2 0.3 0.4 0.5 0.6 0.7 0.8 0.9 1 0.6 0.4 Cross−correlation 0.2 Pixel number 4000 3000 0 0 fa 2 (A) 2000 4 6 Force (N) fb 8 10 0.1 (B) 1000 0.08 0 0 0.1 0.2 0.3 0.4 0.5 0.6 0.7 0.8 0.9 1 Gradient Cross−correlation Fig. 6. The histogram of the normalized cross-correlation between the pulse signal and the coloration changes with normal force at 1 N (A) and 6N (B). 0.06 0.04 IV. L INEAR P REDICTION M ODEL 0.02 As mentioned earlier, certain areas of the fingernail show strong linear responses of coloration to fingertip force in their measuring ranges, others do not. Not just the fingernail areas show this effect, certain areas of the surrounding skin particularly at the base of the nail show a strong linear response as well. The determination of which regions of the fingernail and surrounding skin respond well is done by a linear correlation analysis [2]. Figure 7(A) shows the coloration response hi of one typical point i in the fingernail to normal force on the finger pad. The response curve shows that the coloration starts to change when the force reaches a certain level fa and then stops changing at force fb because of saturation. Point i can only transduce the force in the measurement range [fa , fb ]. To find the measurement range, the coloration response is first fitted with a curve calculated with locally weighted linear regression [6]. Then the gradient curve is obtained by differentiating this fitted curve (Figure 7(B)). Different points in the fingernail and surrounding skin have different measurement ranges. For each mesh element i in those linear response areas, a linear relation between the coloration and the force is built in its measuring range. The start coloration is Ci1 and the saturation coloration is Ci2 . The linear regression model is: F = βi0 + βi1 Ci + εi , Ci ∈ [Ci1 , Ci2 ] where F is the normal force, Ci is the coloration of mesh element i, βi0 and βi1 are unknown parameters to be estimated, and εi is the error. With n pairs of coloration and forces, the least squares estimate of βi is calculated as 0 0 (B) 2 4 6 Force (N) 8 10 Fig. 7. (A) The coloration response data of a point in the fingernail with force from 0–10 N. (B) The gradients and the crossing points (circles) when the threshold gth = 0.03. where F is an n × 1 vector of normal forces, Xi = [I Ci ], and Ci is an n × 1 vector of coloration. a) : Assume the error εi is a random error and has a Gaussian distribution. The estimation force from a coloration measurement is F̂i = β̂i0 + β̂i1 Ci , and F = F̂i + εi b) : Assuming there are m points in the fingernail and on the surrounding skin that can transduce the force F, each point gives an estimate F̂i with random error εi ∼ N (0, σi ). The random error can be lessened by taking the average of m estimates, if all the random errors are independent and have the same distribution. In this environment, the random errors from each point can be assumed to be independent of the condition of force F. The distributions can be normalized to standard normal distributions by multiplying by a factor 1/σi for each estimate. So, the average measurement of force F is: β̂i = Xi (XTi Xi )−1 XTi F 2816 m F̂i /σi F̂ = i=1 m i=1 1/σi 8 5 6 Force (N) Prediction Force (N) 6 4 3 4 2 2 0 0 1 0 0 Fig. 9. 1 2 3 4 5 3 4 The estimation result for fast force. 6 Experimental Force (N) Fig. 8. 2 Time (second) 1 8 Verification example: the measuring range is [0, 6]N. Force (N) 6 V. C ALIBRATION AND V ERIFICATION 4 2 0 0 1 2 3 4 Time (second) Fig. 10. The estimation result for fast force with 0.1 second phase shifting even with phase shifting, the model can not predict small force transacting from unloading to loading, because information was buried by the time delay. 8 6 Force (N) To verify the system, experiments were carried out with 3 subjects. Subjects used their index fingers to press on the rubber plate mounted on the Nano 17 force sensor while the camera monitored the coloration change of the index finger. Subjects were asked to produce slow normal forces (0.2 N/s) with display feedback. 3 sets of data were taken. The first two sets were used for calibration. The measuring range, time constant, linearity, linear model parameters and variance for each mesh elements were calibrated. The third set was used for verification. Figure 8 shows a verification example. The root mean square error for this subject is 0.284 N and the measuring range is from 0 to 6 N. The other 2 subjects had RMS errors 0.370 N and 0.441 N in the measuring ranges from 0-7 N and 0-8 N, respectively. These results illustrate that the coloration on the fingernail can be used to predict forces on finger pad with fairly good accuracy. An experiment was carried out to test how the dynamic features of the fingernail coloration affect the model and the possibility of time compensation. The experiment is similar with the one described above, except that a subject was asked produce fast sinusoid normal forces at 1 Hz for a verification data set. Figure 9 shows the estimation result with linear prediciton model, without considering the dynamic features. We can see that the shapes of the actual versus predicted force are fairly similar, but they are displaced in time. However, since the dynamic analysis shows that there is a mainly 0.1 second delay for loading and large force in unloading and 0.3 second delay for small force unloading, a time compensation can be made by phase shifting according to the time constants. With 0.1 s time compensation, the result is shown in Figure 10. For unloading force, since the delay increases when the force decreases, a linear time phase shifting is made to reflect the fact that smaller force has larger time constant. The time compensation result is shown in Figure 11. As we can see, 4 2 0 0 1 2 3 4 TIme (second) Fig. 11. The estimation result for fast force with linear phase shifting VI. D ISCUSSION The dynamic study presented here shows a rather complex picture of the coloration response with fingertip force in time course. Even for the same measuring point, the time constants are different forn different force levels and directions (loading and unloading). Different subjects also present different dynamic features. But one thing in common is that the time constants for loading and larger force unloading are fairly 2817 small and consistent. Considering the fact that loading and larger force unloading are the main consideration in the study of grasping, with a time course compensation, this imaging method still can be very useful for fast force estimation. The linear model presented here shows very good accuracy for slow force estimation. There are relative bigger errors at the two ends of the measuring range, due to the fact that there are relatively small numbers of measuring points having measuring ranges at those two ends. Using multiple measuring ranges for each measuring point would give better result at the two ends. The investigation of the effect of vascular pulsation shows there is no evidence that the vascular pulsation affects the coloration changes in the fingernail or surrounding skin in any way that is visible to the camera. This observation is probably due to the pool of blood in the fingertip which forms a reservoir. However, there is possibility that some other cardiovascular states may have visible coloration affects. In the future, we will broaden the investigation. In this paper, the green color channel was used for coloration observation, since its response range and linearity is better than the blue and red channels. There are possibly other channels in other color spaces better than the green channel, for measuring range and dynamic response features; one alternative, for example, is the HSI (hue saturation intensity) color space. Our future work will compare different coloration spaces. The dynamic features, the vascular pulsation affect, and the estimation model presented in this paper, are all studied or built with normal force on the fingertip. It is fairly easy to extend the study and the model to cover the shear forces also and it would be our future work. ACKNOWLEDGMENTS This research was partly supported by NSF Grant DMI 9978603 and by a University of Utah Funding Seed Initiation Grant. R EFERENCES [1] G. Baud-Bovy and J.F. Soechting, “Factors influencing variability in load forces in a tripod grasp,” Exp. Brain Res., vol. 143, 57-66, 2002. [2] J.S. Bendat and A.G. Piersol. Engineering Applications of Correlation and Spectral Analysis. Wiley, NY, 1980. [3] S.A. Mascaro and H. H. Asada, “Photoplethysmograph fingernail sensors for measuring finger forces without haptic obstruction,” IEEE Trans. Robotics and Automation, vol. 17, 698-708, 2001. [4] S.A. Mascaro and H.H. Asada, “Understanding of fingernail-bone interaction and fingertip hemodynamics for fingernail sensor design,” Proc 10th Intl. Symposium on Haptic Interfaces for Virtual Environment and Teleoperator Systems, pp. 106-113, 2002. [5] S.A. Mascaro and H.H. Asada, “Measurement of finger posture and three-axis fingertip touch force using fingernail sensors,” IEEE Trans. Robotics and Automation, vol. 20, 26-35, 2004. [6] A.W. Moore, J. Schneider, and K. Deng, “Efficient locally weighted polynomial regression predictions,” Proc. International Machine Learning Conference, Morgan Kaufmann Publishers, 1997. [7] D.T.V. Pawluk and R.D. Howe, “Dynamic lumped element response of the human fingerpad,” ASME J. Biomechanical Engineering, vol. 121, 605-611, 1999. [8] D.T.V. Pawluk and R.D. Howe, “Dynamic contact mechanics of the human fingerpad against a flat surface,” ASME J. Biomechanical Engineering, vol. 121, 178-183, 1999. [9] C.L. Phillips and R.D. Harbor, Feedback Control Systems, 4th ed, Prentic-Hall, Upper Saddle River, NJ, 2000. [10] M.P. Rearick, A. Casares, and M. Santello, “Task-dependent modulation of multi-digit force coordination patterns,” J. Neurophysiol., vol. 89, 1317-1326, 2003. [11] R. Reilmann, A.M. Gordon, and H. Henningsen, “Initiation and development of fingertip forces during whole-hand grasping,” Exp. Brain Res., vol. 140, 443-452, 2001. [12] J.K. Shim, M.L. Latash, and V.M. Zatsiorsky, “Prehension synergies in three dimentions,” J. Newrophysiol, vol. 93, 766-776, 2005. [13] Y. Sun, J.M. Hollerbach, and S.A. Mascaro, “Measuring fingertip forces by imaging the fingernail,” Proc 14th Symposium on Haptic Interfaces for Virtual Environment and Teleoperator Systems, Alexandria, VA, March 25-26, 2006. 2818
