QUARTERLY FINANCIAL STATEMENTS AND OPERATING DATA Relating to: 2007 B
advertisement
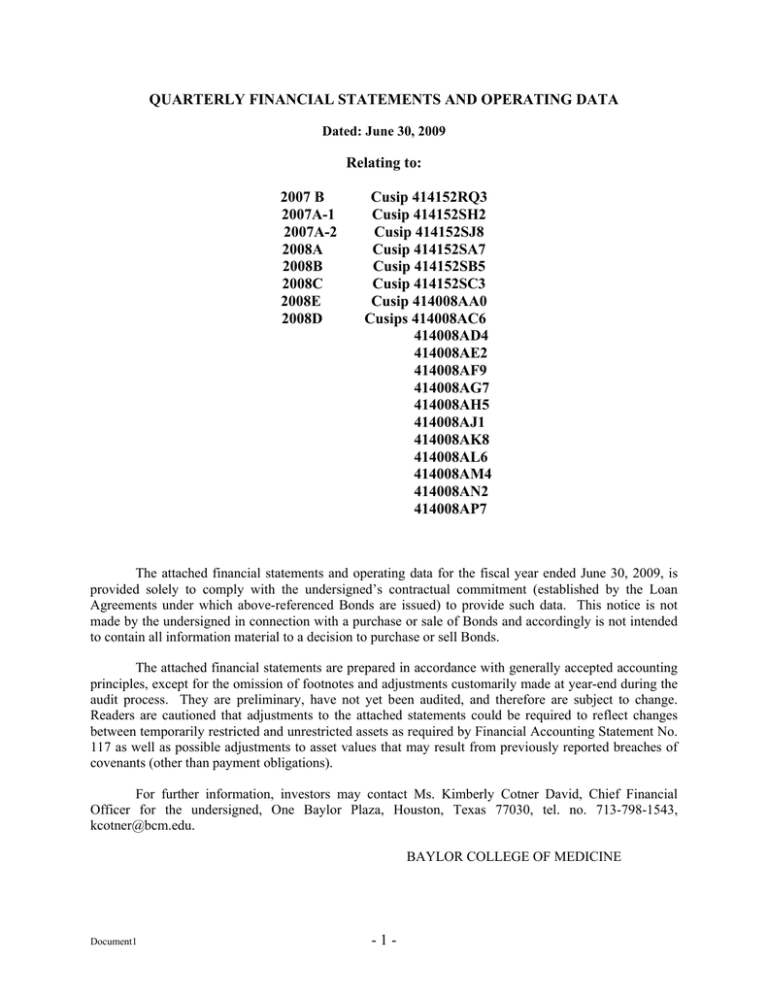
QUARTERLY FINANCIAL STATEMENTS AND OPERATING DATA Dated: June 30, 2009 Relating to: 2007 B 2007A-1 2007A-2 2008A 2008B 2008C 2008E 2008D Cusip 414152RQ3 Cusip 414152SH2 Cusip 414152SJ8 Cusip 414152SA7 Cusip 414152SB5 Cusip 414152SC3 Cusip 414008AA0 Cusips 414008AC6 414008AD4 414008AE2 414008AF9 414008AG7 414008AH5 414008AJ1 414008AK8 414008AL6 414008AM4 414008AN2 414008AP7 The attached financial statements and operating data for the fiscal year ended June 30, 2009, is provided solely to comply with the undersigned’s contractual commitment (established by the Loan Agreements under which above-referenced Bonds are issued) to provide such data. This notice is not made by the undersigned in connection with a purchase or sale of Bonds and accordingly is not intended to contain all information material to a decision to purchase or sell Bonds. The attached financial statements are prepared in accordance with generally accepted accounting principles, except for the omission of footnotes and adjustments customarily made at year-end during the audit process. They are preliminary, have not yet been audited, and therefore are subject to change. Readers are cautioned that adjustments to the attached statements could be required to reflect changes between temporarily restricted and unrestricted assets as required by Financial Accounting Statement No. 117 as well as possible adjustments to asset values that may result from previously reported breaches of covenants (other than payment obligations). For further information, investors may contact Ms. Kimberly Cotner David, Chief Financial Officer for the undersigned, One Baylor Plaza, Houston, Texas 77030, tel. no. 713-798-1543, kcotner@bcm.edu. BAYLOR COLLEGE OF MEDICINE Document1 -1- Baylor College of Medicine Balance Sheets Preliminary and Unaudited/Subject to Change at June 30, 2009 With Comparative Totals at June 30, 2008 (Unaudited) Variance June 30, 2009 June 30, 2008 Dollar Amount Cash & Short Term Investments Cash Held by Bond Trustee Bond Swap Collateral, net Accounts Receivable, net Insurance Receivable Patient Receivables, net Contributions Receivable, net Notes Receivable Investments Security lending collateral Property and Equipment Other Assets Total Assets 64,582,606 348,410,652 0 98,644,293 0 35,180,502 164,666,651 18,592,821 749,258,135 2,952,428 769,916,543 27,756,189 2,279,960,819 61,609,396 503,183,032 0 92,592,925 2,973,210 (154,772,380) 0 6,051,368 36,787,885 166,525,361 18,707,722 1,132,798,057 32,962,223 641,135,290 32,400,447 2,718,702,338 (1,607,383) (1,858,710) (114,901) (383,539,922) (30,009,795) 128,781,253 (4,644,258) (438,741,518) Liabilities and Net Assets Accounts Payable and other liabilities Line of Credit Bond Swap Liability, net Deferred Insurance Proceeds, Net Unexpended current awards Refundable government loan funds Bonds Payable Payable under security lending agreements Total Liabilities 246,221,593 25,000,000 14,099,230 138,754 73,465,824 6,763,122 897,430,985 2,952,428 1,266,071,936 235,584,763 50,000,000 36,893,015 6,341,102 66,932,982 6,811,683 852,181,731 32,962,223 1,287,707,498 10,636,830 (25,000,000) (22,793,785) (6,202,348) 6,532,842 (48,561) 45,249,254 (30,009,795) (21,635,563) 377,793,949 309,502,652 326,592,281 1,013,888,883 893,288,745 221,583,028 316,123,066 1,430,994,840 (515,494,796) 87,919,624 10,469,215 (417,105,957) 2,279,960,819 2,718,702,338 (438,741,518) Assets Net Assets Unrestricted Temporarily Restricted Permanently Restricted Total Net Assets Total Liabilities and Net Assets Baylor College of Medicine Statement of Activities Preliminary and Unaudited/Subject to Change June 30, 2009 Unrestricted State appropriation and Net Tuition Government and private grants and contracts Direct recoveries Facilities and administrative recoveries Affiliated hospital contracts Medical services Other academic activities Investment income Contributions Equipment acquired through grants and contracts Temp Restricted Releases $ Total revenues Education Research Medical services Affiliated hospital clinical services Institutional support and Operations of Plant Depreciation Interest 113,961 24,091,564 863,595 (37,358,176) 0 0 1,154,749,489 (12,289,056) 0 $ 2,926,744 5,229,921 1,562,105 (217,304,235) (3,579,052) 354,740 (442,769,383) (515,494,795) 893,288,745 $ 0 (12,289,056) (1,989,169) 0 (416,746) 377,793,950 50,164,865 308,806,789 65,043,112 306,495,931 247,878,037 43,480,646 58,543,942 52,615,353 9,431,758 0 1,142,460,433 117,901,107 352,743,747 242,009,309 301,333,252 129,006,475 65,805,909 18,675,102 (72,725,413) 0 0 0 (171,254,486) (52,877,521) (191,762) Total $ 308,806,789 65,043,112 306,495,931 247,878,037 43,480,646 58,429,981 28,523,789 8,568,163 37,358,176 1,227,474,901 Total increase(decrease) in Net Assets Net Assets - June 30, 2008 Net Assets - June 30, 2009 50,164,865 117,901,107 352,743,747 242,009,309 301,333,252 129,006,475 65,805,909 18,675,102 Total expenses Contributions non equipment capital Net realized gains(losses) on investment, net of distribution Interest income Change in net unrealized gains(losses) on investment Investment (loss) income, net of distribution Change in net unrealized gains(losses) on swap Non equip assets acquired by grants and contracts Loss on disposal & write-down of property and equipment Storm Litigation & application costs Gain on Storm Insurance Proceeds Net assets released from restrictions, transfers and other Cummulative net effect of FASB 117 implementation Retirement of bond original issue cost Discontinued Operations Change in net assets from non-operating activities (Unaudited and Subject to Change) Temporarily Permanently Restricted Restricted 0 0 0 0 (120,763,372) 0 0 0 (85,014,469) 16,005,834 24,162,499 0 0 0 0 (297,554,477) (52,877,521) (191,762) 0 0 0 (5,536,619) 0 0 0 0 0 1,227,474,901 0 0 0 (1,989,169) 0 (416,746) 0 0 0 0 10,469,215 0 0 (3,579,052) 354,740 $ (332,091,488) 87,919,624 221,583,028 10,469,215 316,123,066 (417,105,956) 1,430,994,840 $ 309,502,652 $ 326,592,281 (1,562,105) 217,304,235 0 0 $ 100,208,680 $ $ 1,013,888,884 Baylor College of Medicine Statement of Activities as of June 30, 2008 Unrestricted Operating Activities Revenues State appropriation and Net Tuition Government and private grants and contracts Direct recoveries Facilities and administrative recoveries Affiliated hospital contracts Medical services Other academic activities Investment income Contributions Equipment acquired through grants and contracts Temp Restricted Releases Total revenues Temporarily Restricted Permanently Restricted Total 51,388,111 51,388,111 294,204,448 62,681,750 197,500,435 296,748,864 48,296,914 58,839,626 19,520,726 7,552,949 35,578,742 107,754 16,803,798 345,471 (35,578,742) 0 0 294,204,448 62,681,750 197,500,435 296,748,864 48,296,914 58,947,380 36,324,524 7,898,420 0 1,072,312,565 (18,321,720) 0 1,053,990,845 Expenses Education Research Medical services Affiliated hospital clinical services Institutional support and Operations of Plant Depreciation Interest Total expenses Revenues Over / (Under) Expenses Non-operating Activities Contributions non equipment capital Net realized gains(losses) on investment, net of distribution Interest income Change in net unrealized gains(losses) on investment Non equip assets acquired by grants and contracts Loss on disposal & write-down of property and equipment Storm Litigation & application costs Net assets released from restrictions, transfers and other Retirement of bond original issue cost Change in net assets from non-operating activities Total increase(decrease) in Net Assets Net Assets - June 30, 2007 Net Assets - June 30, 2008 121,127,852 351,191,484 299,660,518 193,864,842 105,272,352 59,119,228 9,957,707 1,140,193,982 121,127,852 351,191,484 299,660,518 193,864,842 105,272,352 59,119,228 9,957,707 0 (67,881,417) (18,321,720) 2,618,963 32,270,641 41,906,361 423,043 (204,899,299) 511,759 (5,628,064) (259,727) 2,577,002 (5,312,286) (168,062,249) 85,978 0 (775,840) 0 0 0 (2,577,002) 0 29,003,777 0 1,140,193,982 0 (86,203,137) 11,612,700 46,502,304 0 46,881,703 426,407 (207,965,475) 511,759 4,889,364 3,364 (2,290,336) 0 0 0 (5,628,064) (259,727) 0 0 14,215,093 0 (5,312,286) (124,843,379) (235,943,665) 1,129,232,411 10,682,057 210,900,971 14,215,093 301,907,974 (211,046,516) 1,642,041,356 893,288,745 221,583,028 316,123,066 1,430,994,840 Baylor College of Medicine Statement of Cash Flows Preliminary and Unaudited/Subject to Change as of June 30, 2009 (Unaudited) June 30, 2009 (417,106) June 30, 2008 (211,047) Depreciation Loss on disposal & write down of P&E Non-cash contributions of property Investment income reinvested Change in net unrealized (gains)/losses on investments Change in net unrealized (gains)/losses on swap Change in patient receivables Change in contributions receivable Change in accounts receivable Contributions restricted for long-term investment Net realized (gains)/losses on sale of investments (Increase)/Decrease in other assets Increase/(Decrease) in accounts payable & other liabilities Net cash provided by (used in) operating activities 65,806 1,989 (7,514) (5,469) 247,374 52,878 1,607 1,859 (6,051) (16,006) 10,627 4,644 7,893 (57,470) 59,119 5,628 (7,719) (7,535) 164,375 43,591 (1,562) (9,576) (21,473) (11,613) (74,723) (7,822) 71,862 (8,494) Cash Flow from Investing Activities Change in investments (net) (1) Purchases of property and equipment Investment income reinvested Disbursement & repayment of loans (net) Net Cash provided by (used in) investing activities 125,539 (189,062) 5,469 115 (57,939) 62,899 (171,930) 7,535 (1,466) (102,962) (25,000) (75,671) (243,150) 36,425 255,000 50,000 Cash Flow from Operating Activities Change in net assets Adjustments to reconcile increase/(decrease) in net assets to net cash provided by/(used in) operating activities Cash Flow from Financing Activities Change in line of credit payable (Increase)/Decrease in bond swap collateral Repayments of bonds payable Proceeds from retirement of 2005 B Bonds held by college Proceeds from issuance of 2008D bonds 2007 A/B bond issuance proceeds 2008 A/B/C bond issuance proceeds 2007 A bond refunding Purchase 2005 B bonds Contributions restricted for long-term investment Net Cash provided by (used in) financing activities 16,006 (36,390) Net Change in cash and cash equivalents Cash & short-term investments - June 30, 2007 Cash & short-term investments - June 30, 2008 Cash & short-term investments(2) - as of June 30, 2009/ as of June 30, 2008 (151,799) 600,000 157,730 (155,000) (36,425) 11,613 624,943 513,487 51,306 564,792 $ (1) Represents fiscal year change in balance sheet investments adjusted for net realized gains/losses in operating activities and net unrealized gains/losses on investments in nonoperating activities (2) Includes "Cash held by Bond Trustee" on Balance Sheet (2,975) 412,993 564,792 Baylor College of Medicine for the Trailing Twelve Months through June 30, 2009 Moody's Median FYE Covenants June 2008 July 2008 Aug 2008 Sept 2008 Oct 2008 Nov 2008 Dec 2008 Jan 2009 Days Cash on Hand (1) 157 180 244 5.6 232 5.2 233 3.8 203 3.2 159 2.1 146 2.1 115 1.3 105 1.1 Operating Margin (%) (2) 2.1 (6.9) -2.7 (6.8) -2.7 (4.1) -2.0 (6.9) -2.7 (6.2) -2.6 (6.0) -2.5 (5.8) -2.4 (6.1) -2.5 Operating Cash Flow Margin (%) (3) 9.0 (0.4) (0.4) 2.6 (0.2) 0.2 1.1 1.3 Debt-to-Capitalization (%) (4) 38.6 65 50.2 0.0 50.9 0.0 52.7 0.0 57.4 -0.1 61.0 -0.2 67.6 -0.3 Cash-to-Debt (%) (5) 111 65 91 88 84 69 57 Days Receivable (6) 49.1 51 52 50 53 Debt Service Coverage Ratio (7) 3.9 2.3 0.9 1.0 Financial Strength Index (8) 0-3 1.6 1.3 2.0 1.2 March 2009 April 2009 May 2009 106 1.1 108 1.2 120 1.4 (5.9) -2.5 (5.8) -2.4 (6.0) -2.5 (5.6) -2.4 (6.3) -2.6 1.0 1.4 1.5 1.3 1.6 1.0 69.0 -0.4 69.0 -0.4 72.0 -0.4 72.0 -0.4 70.0 -0.4 67.0 -0.3 71.0 -0.4 55 45 42 38 40 43 46 37 53 51 55 52 53 52 49 50 48 0.3 (0.1) 0.0 0.1 (0.3) (0.4) (0.6) (0.7) (0.6) (0.8) 0.5 (0.4) (0.5) (1.3) (1.6) (1.8) (1.5) (1.5) (1.1) (1.9) 0.3 (1) ((Cash & Short-Term Investments + Investments - True Endowment & Perm Restricted Assets - Private Equity - Other Investments) - (Line of Drawn Credit Revolver - Amount Due on Calendar Year 2009) / (Total Expenses/366 days) (2) Total Surplus (Deficit) / Total Revenues (3) (Total Surplus (Deficit) + Interest + Depreciation) / Total Revenues (4) (Bonds Payable + Line of Drawn Credit Revolver + Swap Not Collaterized) / (Total Debt + Unrestricted Net Assets) (5) (Cash & Short-Term Investments + Investments - True Endowment & Perm Restricted Assets - Private Equity - Other Investments) / Long-Term Debt (6) (Total Accounts & Patient Receivables + Notes Receivables) / (Total Revenues / 365) (7) (Unrestricted Operating Revenues over/(under) expenses + realized gains(losses) - contributions non-equipment capital - non-equipment assets acquired through grants and contracts - loss on disposal and write downs of property and equipment, net + depreciation + interest) / (Pro-Rated Maximum Annual Debt Service Requirements on Long-Term Debt for period) (8) ((Operating Margin - 4)/4) + ((Days Cash on Hand - 50)/50) - ((Debt-to-Capitalization - 50)/50) - ((Accumulated Depreciation Expense % - 50)/50) The June 30, 2009 covenant ratios are adjusted for FAS117. They are considered preliminary and subject to change. Feb 2009 93 0.9 June 2009 92 0.8
