ULTRA WIDEBAND INTERFERENCE EFFECTS ON AN AMATEUR RADIO RECEIVER UltRa Lab
advertisement

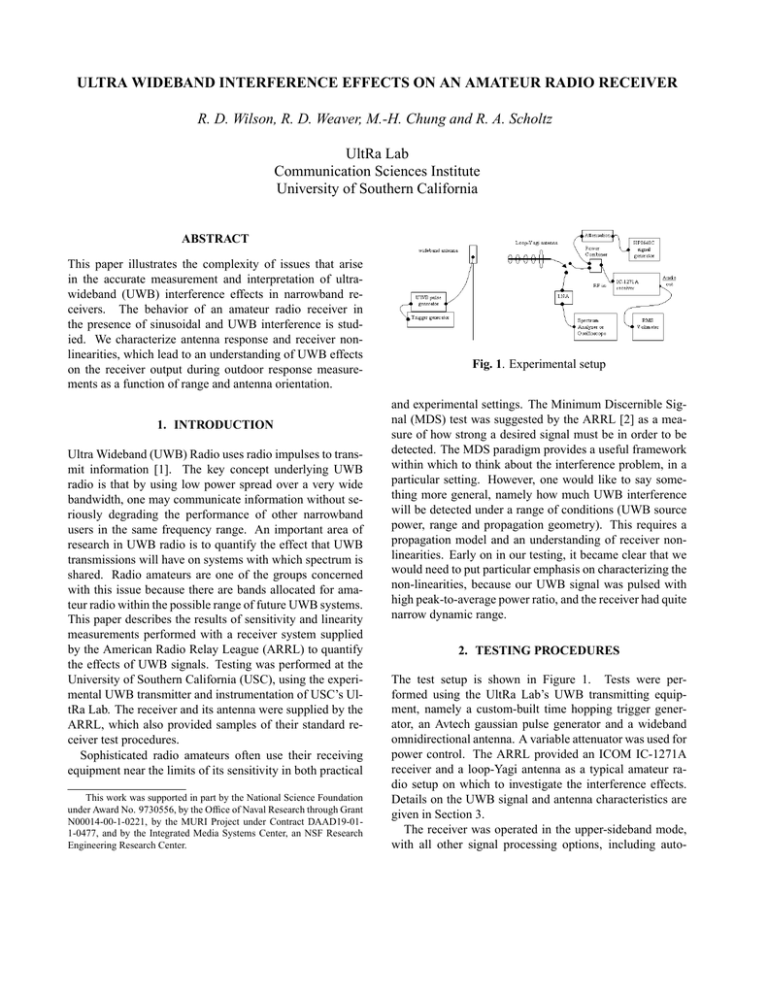
ULTRA WIDEBAND INTERFERENCE EFFECTS ON AN AMATEUR RADIO RECEIVER R. D. Wilson, R. D. Weaver, M.-H. Chung and R. A. Scholtz UltRa Lab Communication Sciences Institute University of Southern California ABSTRACT This paper illustrates the complexity of issues that arise in the accurate measurement and interpretation of ultrawideband (UWB) interference effects in narrowband receivers. The behavior of an amateur radio receiver in the presence of sinusoidal and UWB interference is studied. We characterize antenna response and receiver nonlinearities, which lead to an understanding of UWB effects on the receiver output during outdoor response measurements as a function of range and antenna orientation. 1. INTRODUCTION Ultra Wideband (UWB) Radio uses radio impulses to transmit information [1]. The key concept underlying UWB radio is that by using low power spread over a very wide bandwidth, one may communicate information without seriously degrading the performance of other narrowband users in the same frequency range. An important area of research in UWB radio is to quantify the effect that UWB transmissions will have on systems with which spectrum is shared. Radio amateurs are one of the groups concerned with this issue because there are bands allocated for amateur radio within the possible range of future UWB systems. This paper describes the results of sensitivity and linearity measurements performed with a receiver system supplied by the American Radio Relay League (ARRL) to quantify the effects of UWB signals. Testing was performed at the University of Southern California (USC), using the experimental UWB transmitter and instrumentation of USC’s UltRa Lab. The receiver and its antenna were supplied by the ARRL, which also provided samples of their standard receiver test procedures. Sophisticated radio amateurs often use their receiving equipment near the limits of its sensitivity in both practical This work was supported in part by the National Science Foundation under Award No. 9730556, by the Office of Naval Research through Grant N00014-00-1-0221, by the MURI Project under Contract DAAD19-011-0477, and by the Integrated Media Systems Center, an NSF Research Engineering Research Center. Fig. 1. Experimental setup and experimental settings. The Minimum Discernible Signal (MDS) test was suggested by the ARRL [2] as a measure of how strong a desired signal must be in order to be detected. The MDS paradigm provides a useful framework within which to think about the interference problem, in a particular setting. However, one would like to say something more general, namely how much UWB interference will be detected under a range of conditions (UWB source power, range and propagation geometry). This requires a propagation model and an understanding of receiver nonlinearities. Early on in our testing, it became clear that we would need to put particular emphasis on characterizing the non-linearities, because our UWB signal was pulsed with high peak-to-average power ratio, and the receiver had quite narrow dynamic range. 2. TESTING PROCEDURES The test setup is shown in Figure 1. Tests were performed using the UltRa Lab’s UWB transmitting equipment, namely a custom-built time hopping trigger generator, an Avtech gaussian pulse generator and a wideband omnidirectional antenna. A variable attenuator was used for power control. The ARRL provided an ICOM IC-1271A receiver and a loop-Yagi antenna as a typical amateur radio setup on which to investigate the interference effects. Details on the UWB signal and antenna characteristics are given in Section 3. The receiver was operated in the upper-sideband mode, with all other signal processing options, including auto- −100 4.5 4 −105 3.5 Volts 2.5 2 1.5 1 0.5 0 −0.5 0 2 4 6 8 10 Time (ns) 12 14 16 18 20 Power in 30Hz resolution bandwidth 3 −110 −115 −120 −125 (a) Pulse shape at the pulser output −130 200 −135 −1500 150 −1000 −500 0 500 1000 1500 Frequency (Hz) 2000 2500 3000 3500 100 milliVolts 50 Fig. 3. Narrowband spectrum analyzer trace of the received UWB signal at full power, overlaid with the receiver’s audio passband when tuned to 1296 MHz (dotted line, with arbitrary dB offset). The resolution bandwidth is 30 Hz. 0 −50 −100 −150 −200 0 5 10 15 20 25 Time (ns) 30 35 40 45 50 (b) Waveform received by a UWB antenna 200 150 100 milliVolts 50 0 −50 −100 −150 −200 0 5 10 15 20 25 Time (ns) 30 35 40 45 50 (c) Waveform received by the loop-Yagi antenna Fig. 2. UWB waveforms matic gain control, turned off. The RF gain was set at maximum while the audio gain (volume) knob was adjusted so that audio noise output was nominally 30 mV(RMS) when no input was present. The audio ”tone” control was set to mid-range. A digital voltmeter was used to measure the audio output. Testing included signal characterization and linearity tests in a laboratory environment, followed by interference measurements outdoors. UWB signal characterization was done with a HP54750A high-speed oscilloscope and a HP8563E spectrum analyzer. Since neither instrument has particularly good noise figure, a broadband low-noise amplifier (LNA) was inserted where needed to aid in these characterizations. All measurements are corrected for the gain of the LNA and for cable losses, where applicable. To evaluate receiver linearity, the output of the receiver tuned to 1296 MHz was observed over a range of radiated UWB powers, to determine what level of UWB interference will drive the receiver into saturation. As a basis for comparison, the same test was performed using a calibrated continuous wave (CW) input to the receiver, such as to produce a 1000 Hz audio tone. The MDS is the input signal level required to cause a 3 dB rise in the output audio power with respect to the power when no input is applied. If the receiver is operating linearly, it is a measure of the input noise-plus-interference power within the passband of the receiver. Therefore, measuring the output power of the receiver, in linear response conditions, also yields the MDS if the receiver gain is known. 3. SIGNAL AND ANTENNA CHARACTERISTICS The elementary UWB signal used in these tests is a gaussian pulse of approximately 0.7 ns duration at 50% amplitude and with 90% bandwidth of 1.5 GHz. The pulse shapes at the output of the pulser, after transmission between two ultra-wideband diamond-dipole [5] antennas, and after transmission between one diamond dipole and the loop-Yagi are shown in Figures 2(a), (b) and (c), respectively. The time-average pulser output power is -10.3 dBm in the time-hopped mode, including transmission line losses between the pulser and transmit antenna. The time hopping system generates a sequence of 1023 pulses, randomly pulse position modulated at an average interval of 1.27µs, 4. EXPERIMENTAL RESULTS In Figure 3, we can see how the UWB spectrum relates to the passband of the receiver tuned to 1296 MHz. There are four major spectral peaks within the receiver passband. As the receiver is tuned, a different number of peaks may enter the band and the detected interference power may change. Because the receiver passband is approximately 2.5 kHz, and the peaks are spaced at 770 Hz intervals, there will always be three or four peaks within the passband, so we should expect a variation in interference level of about 4/3 or 1.25 dB, plus any variations due to the shape of the signal spectrum itself. We will see in section 4.2 that the interference level varies about 3.5 dB when receiver response is linear. 4.1. Receiver Linearity The receiver linearity was characterized for both UWB and sinusoidal signals. In Figure 4 we see that the receiver behaves differently in each case. The response due to the calibrated CW source may be considered as firmly known, while the horizontal alignment of the UWB curve was more difficult to establish. It involves estimating the portion of input power, already filtered by the antennas, contained within the passband of the receiver. This may be done by reference to Figure 3, or using the time domain waveform of Figure 2(c). In the latter case, we can estimate the average 55 sinusoidal input uwb time hopped input 50 45 Net audio power out (dBmV) thus producing an overall waveform period of 1.3 ms. In Figure 3, the UWB spectrum is shown over a 4 kHz range about 1296 MHz, measured between a wideband diamonddipole transmit antenna and the loop-Yagi receive antenna at a separation of 3 m. Overlayed is the measured frequency response of the ICOM receiver when tuned to that frequency, plotted on an arbitrary dB scale. Because of its periodicity, the UWB test signal has a line spectrum. The 1.3 ms period indicates that we should expect spectral lines at intervals of approximately 770 Hz. The expected 770 Hz spaced lines are apparent, as are other, generally weaker, lines due to idiosyncracies of the transmitter hardware. All measurements were performed using no data modulation. Random data modulation will disrupt the periodicity of the signal and therefore further smooth the distribution of power over frequency. The UWB antenna gain pattern and frequency response are plotted in Figure 7(a). Its polarization is vertical. The gain pattern and frequency response of the loop-Yagi antenna are shown in Figure 7(b). Its polarization was found to be nearly linear and it was oriented for maximum response. To ensure repeatable results, the loop-Yagi was pointed directly at the UWB antenna during signal characterization and linearity testing. 40 35 30 noise floor=30mVrms 25 20 −150 −145 −140 −135 −130 −125 −120 average RF power input (dBm) −115 −110 −105 Fig. 4. Receiver linearity at maximum RF gain. Antenna separation was 2 m for the UWB case. power in the passband of the receiver by taking a discrete Fourier transform and using our knowledge of the average pulse period. By this method, at full transmitter power (the rightmost point in Figure 4), the average received UWB power within the receiver passband is approximately -107 dBm, which justifies the horizontal positioning of the UWB curve to within 2 dB. Assuming that our placement of the UWB curve is correct, the plot shows that the receiver begins to behave nonlinearly at approximately 5 dB lower average input power when the UWB signal is present compared to the sinusoidal signal. Also note the 5 dB lower compressed output level for the UWB signal. This is thought to be due to the low duty cycle of the pulse waveform, in that the receiver is in compression due to the high peak power, but this amount of power is not always present as it would be in a sinusoidal signal. For some portion of the time between pulse arrivals the input power is much lower than the peak and the receiver is not saturated, therefore although the response is non-linear, the average output power is reduced. The 5 dB difference in both the compressed output power and the saturation point suggests a duty cycle for the UWB waveform within the receiver of approximately 30% at the point where compression occurs. This indicates that the pulses are undergoing compression in an early IF stage with bandwidth of about 2.5 MHz. With the receiver in compression, the measured interference level is lower than would be the case if response were linear. The compressed receiver stage acts as a bandpass limiter, which is well known to help reduce the effects of pulsed interference. A lower duty cycle UWB signal of equal average power, whose higher peak power would be compressed in an earlier receiver stage, would produce even less output interference. The UWB linearity plot shows that the receiver will op- −120 55 UWB + Noise MDS (est.) Noise only Two−ray model UWB−0 deg 50 UWB−15 deg UWB−30 deg Noise −125 RF power in (dBm) RMS audio output (dBmV) 45 40 35 −130 30 25 20 0 10 −135 1 10 Antenna separation (m) 2 10 Fig. 5. Measured audio output vs. range and antenna boresight angle. An idealized two-ray model is shown for comparison. erate linearly if the input power is reduced by at least 15 dB. Therefore, increasing antenna separation to a minimum of approximately 12 meters in free space should also result in linear operation. This estimate of minimum separation is supported in the following section. 4.2. Outdoor Measurements and MDS Estimate Outdoor tests were performed to confirm ranges and antenna orientations where the receiver could be expected to behave linearly. This was done on the top floor of a parking structure at USC. In addition to the direct path and the ground reflection, there may have been other significant reflections due to perimeter walls and metal fences. The audio output of the receiver was measured at different separations and the receiving loop-Yagi antenna was pointed 0, 15 and 30 degrees away from the transmit antenna, with the UWB signal at full power. The results are shown in Figure 5. Here, measured noise is subtracted from the UWB measurements. Also plotted are the predictions of a simple two-ray model over an ideal ground plane, modified from [3]. The model assumes idealized antenna patterns similar to Figure 7 and linear response extrapolated from Figure 4. Clearly the model does not match the measurements very well, but it does provide a useful frame of reference in which to interpret our results. Viewed in this light, the data support our expectation that audio output is compressed to a constant for separations less than about 12 meters with the loop-Yagi antenna boresighted, due to the non-linearity of the receiver. The presence of a shallow null near 20 meters also suggests that we are on the right track, but that the re- 0 5 10 15 20 Frequency offset from 1296 MHz (kHz) 25 30 Fig. 6. Outdoor UWB response measured at 24 m range and 30 degrees off boresight. The MDS estimate is corrected for the excess power of our transmitter. flected ray is considerably weaker than is assumed by the model. Having determined the minimum antenna separation required by the receiver to operate linearly, we performed a final series of measurements aimed at estimating the MDS. We chose a 24 meter separation, with the receiving loopYagi antenna pointed 30 degrees away from the UWB transmitter. The test was done over a 30 kHz span in 1 kHz steps beginning at 1296 MHz, with the UWB signal alternately turned on and off. The results are shown in Figure 6. The scaling of the vertical axis is based on Figure 4. The UWB signal produced an output power 5 to 8 dB above the receiver noise floor, while the noise varied less than 1 dB. The variability of the UWB-induced output is due to the line spectrum of the UWB signal. 5. COEXISTENCE AND REGULATION In this paper, we studied the behavior of an amateur radio receiver in the presence of the UWB interference. It is important to understand the limitations of the data presented above. Our UWB signals did not conform to proposed UWB regulatory limits on average power spectral density [6]. The limit, below 2 GHz, is 12 dB below 500 µV/m into any 1 MHz of bandwidth at 3 m. Our calculations show that our output at 1296 MHz was 287 µV/m per MHz, or roughly 7 dB higher. Figure 6 shows our best estimate of what the receiver’s MDS might have been if our transmitter had been in compliance with the proposed limit. Test configurations were chosen, not as realistic interference scenarios, but rather to facilitate obtaining reasonably clean and repeatable measurements and to achieve an 10 0 0 −10 −10 Gain (dB) 10 Gain (dB) understanding of potentially important effects. Pointing a beam antenna directly at the source of UWB interference at close range in an enclosed space, as we did, is a good way to measure interference effects, but the results cannot be taken as a direct illustration of the impact of UWB on amateur radio in general. Despite our emphasis in this paper on characterizing and later avoiding non-linearities in receiver response measurements, one should not assume that this non-linear behavior is undesirable. To the contrary, in this case, a high peak-toaverage power ratio UWB signal caused less interference than did a CW input having equal average power in-band, as was pointed out in Section 4.1. Notwithstanding any other considerations motivating FCC’s proposed limits on peakto-average power ratios, this narrowband receiver system would probably benefit from an even higher ratio. Since the pulse width seen by the receiver is effectively set by its antenna, this might mean raising the UWB pulse amplitude while slowing the pulse repetition frequency to maintain the same average power level. −20 −20 −30 −30 −40 −40 −90 Acknowledgments −60 −30 0 30 Azimuth (degrees) The authors wish to thank ARRL, and particularly Ed Hare for the use of their receiver. Thanks are also due to S. Chang, C.-C. Chui, M. Nemati, S. Ramanujam and R. Tarif for their help with the experiments. 60 90 0 0.5 1 1.5 Frequency (GHz) 2 0.5 1 1.5 Frequency (GHz) 2 (a) UWB antenna 10 10 0 0 −10 −10 [2] M. Tracy and M. Gruber, Test Procedures Manual, Rev. F, American Radio Relay League, June 2000. [3] T. S. Rappaport, Wireless Communications: Principles & Practice, Prentice Hall, 1996. [4] R. A. Scholtz et. al., ”UWB Deployment Challenges,” invited paper, Proc. PIMRC’00, Sep. 2000. [5] H. G. Schantz and L. Fullerton, ”The Diamond Dipole: A Gaussian Impulse Antenna,” Proc. IEEE AP-S Int. Symp., July 2001. [6] Federal Communications Commission, ”Revision of Part 15 of the Commission’s Rules Regarding UltraWideband Transmission Systems,” NPRM 00-163, May 10, 2000. Gain (dB) [1] R. A. Scholtz and M. Z. Win, ”Impulse Radio,” invited paper, Proc. PIMRC’97, Sep 1997. Gain (dB) 6. REFERENCES −20 −20 −30 −30 −40 −40 −90 −60 −30 0 30 Azimuth (degrees) 60 90 0 (b) 14-element loop-Yagi antenna Fig. 7. The 1296 MHz azimuth pattern and boresight frequency response of the two antennas


