Rising stream and river temperatures in the United States T RESEARCH COMMUNICATIONS
advertisement
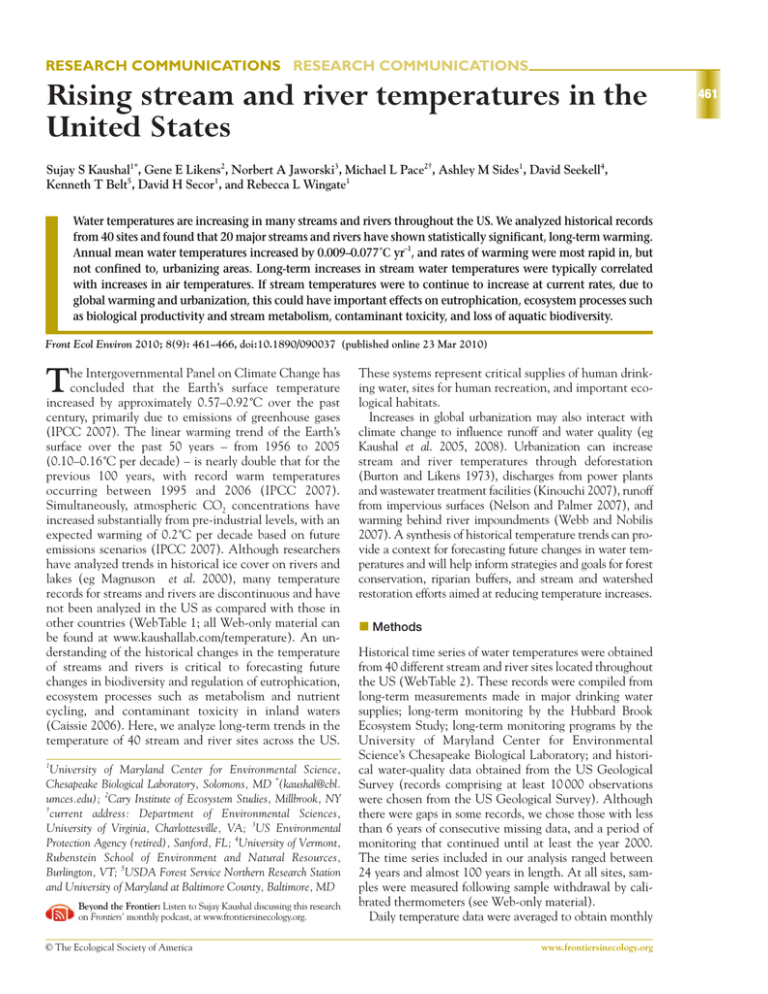
RESEARCH COMMUNICATIONS RESEARCH COMMUNICATIONS Rising stream and river temperatures in the United States Sujay S Kaushal1*, Gene E Likens2, Norbert A Jaworski3, Michael L Pace2†, Ashley M Sides1, David Seekell4, Kenneth T Belt5, David H Secor1, and Rebecca L Wingate1 Water temperatures are increasing in many streams and rivers throughout the US. We analyzed historical records from 40 sites and found that 20 major streams and rivers have shown statistically significant, long-term warming. Annual mean water temperatures increased by 0.009–0.077˚C yr–1, and rates of warming were most rapid in, but not confined to, urbanizing areas. Long-term increases in stream water temperatures were typically correlated with increases in air temperatures. If stream temperatures were to continue to increase at current rates, due to global warming and urbanization, this could have important effects on eutrophication, ecosystem processes such as biological productivity and stream metabolism, contaminant toxicity, and loss of aquatic biodiversity. Front Ecol Environ 2010; 8(9): 461–466, doi:10.1890/090037 (published online 23 Mar 2010) T he Intergovernmental Panel on Climate Change has concluded that the Earth’s surface temperature increased by approximately 0.57–0.92˚C over the past century, primarily due to emissions of greenhouse gases (IPCC 2007). The linear warming trend of the Earth’s surface over the past 50 years – from 1956 to 2005 (0.10–0.16˚C per decade) – is nearly double that for the previous 100 years, with record warm temperatures occurring between 1995 and 2006 (IPCC 2007). Simultaneously, atmospheric CO2 concentrations have increased substantially from pre-industrial levels, with an expected warming of 0.2˚C per decade based on future emissions scenarios (IPCC 2007). Although researchers have analyzed trends in historical ice cover on rivers and lakes (eg Magnuson et al. 2000), many temperature records for streams and rivers are discontinuous and have not been analyzed in the US as compared with those in other countries (WebTable 1; all Web-only material can be found at www.kaushallab.com/temperature). An understanding of the historical changes in the temperature of streams and rivers is critical to forecasting future changes in biodiversity and regulation of eutrophication, ecosystem processes such as metabolism and nutrient cycling, and contaminant toxicity in inland waters (Caissie 2006). Here, we analyze long-term trends in the temperature of 40 stream and river sites across the US. 1 University of Maryland Center for Environmental Science, Chesapeake Biological Laboratory, Solomons, MD *(kaushal@cbl. umces.edu); 2Cary Institute of Ecosystem Studies, Millbrook, NY † current address: Department of Environmental Sciences, University of Virginia, Charlottesville, VA; 3US Environmental Protection Agency (retired), Sanford, FL; 4University of Vermont, Rubenstein School of Environment and Natural Resources, Burlington, VT; 5USDA Forest Service Northern Research Station and University of Maryland at Baltimore County, Baltimore, MD Beyond the Frontier: Listen to Sujay Kaushal discussing this research on Frontiers’ monthly podcast, at www.frontiersinecology.org. © The Ecological Society of America These systems represent critical supplies of human drinking water, sites for human recreation, and important ecological habitats. Increases in global urbanization may also interact with climate change to influence runoff and water quality (eg Kaushal et al. 2005, 2008). Urbanization can increase stream and river temperatures through deforestation (Burton and Likens 1973), discharges from power plants and wastewater treatment facilities (Kinouchi 2007), runoff from impervious surfaces (Nelson and Palmer 2007), and warming behind river impoundments (Webb and Nobilis 2007). A synthesis of historical temperature trends can provide a context for forecasting future changes in water temperatures and will help inform strategies and goals for forest conservation, riparian buffers, and stream and watershed restoration efforts aimed at reducing temperature increases. n Methods Historical time series of water temperatures were obtained from 40 different stream and river sites located throughout the US (WebTable 2). These records were compiled from long-term measurements made in major drinking water supplies; long-term monitoring by the Hubbard Brook Ecosystem Study; long-term monitoring programs by the University of Maryland Center for Environmental Science’s Chesapeake Biological Laboratory; and historical water-quality data obtained from the US Geological Survey (records comprising at least 10 000 observations were chosen from the US Geological Survey). Although there were gaps in some records, we chose those with less than 6 years of consecutive missing data, and a period of monitoring that continued until at least the year 2000. The time series included in our analysis ranged between 24 years and almost 100 years in length. At all sites, samples were measured following sample withdrawal by calibrated thermometers (see Web-only material). Daily temperature data were averaged to obtain monthly www.frontiersinecology.org 461 Rising stream and river temperatures 12 8 r2 = 0.31 4 P < 0.05 0 1970 1980 1990 Year 2000 25 20 15 r2 = 0.39 P < 0.05 5 0 1965 1973 1981 1989 Year 1997 12 8 r2 = 0.14 P < 0.05 4 0 1900 2010 Delaware River, Chester, Pennsylvania 10 16 1920 1940 1960 Year 1980 20 16 r2 = 0.28 P < 0.05 8 4 0 2005 1972 1980 1988 1996 Year 20 16 12 r2 = 0.29 8 P < 0.05 4 0 1965 2000 Brandywine Creek, Chadds Ford, Pennsylvania 12 Delaware River, Ben Franklin Bridge, Pennsylvania and New Jersey Annual mean temperature (˚C) Watershed 3 1960 Annual mean temperature (˚C) Annual mean temperature (˚C) 16 20 Annual mean temperature (˚C) Annual mean temperature (˚C) 20 Annual mean temperature (˚C) Hudson River, Poughkeepsie drinking water supply, New York Hubbard Brook, New Hampshire 1973 1981 1989 Year 1997 2005 Potomac River, Washington DC drinking water supply 20 16 12 r2 = 0.43 8 P < 0.05 4 0 1900 2004 1920 1940 1960 1980 Year 2000 2020 Annual mean temperature (˚C) 20 16 12 r2 = 0.38 8 P < 0.05 4 0 1920 1940 1960 Year 1980 2000 Flathead River, Columbia Falls, Montana 10 8 6 2 r = 0.40 4 P < 0.05 2 0 1979 1984 1989 1994 Year 1999 2004 Annual mean temperature (˚C) Patuxent River, Solomons, Maryland Annual mean temperature (˚C) 462 SS Kaushal et al. Rogue River, McLeod, Oregon 10 8 6 r2 = 0.42 P < 0.05 4 2 0 1979 1984 1989 1994 Year 1999 2004 Figure 1. Examples of long-term trends in historical water temperature in streams and rivers in the US (linear regression). Results from comparative analyses for all datasets using Mann-Kendall trend test and Sen’s slope estimates are also found in WebTable 3. mean temperatures. Monthly mean temperatures were averaged over a 12-month annual period to obtain annual mean temperatures (see Web-only material). Long-term trends in annual mean temperatures were analyzed by both simple linear regression and non-parametric Mann-Kendall trend tests with Sen’s slope estimates (WebTable 3). Linear regression was used because of its statistical power when normality assumptions are met, and non-parametric MannKendall was used for comparison, because it is robust to outliers. Both statistical approaches have been reported for similar studies (eg Ashizawa and Cole 1994; Webb and Nobilis 1995; Durance and Ormerod 2007). A comparison showed there were very few differences regarding the significance of trends when comparing both methods (only six analyses out of 40 systems differed); in five of these cases, there was a significant trend (P < 0.05) observed using the Mann-Kendall test where the linear regression showed no significance at P < 0.05 (WebTable 3). Historical air temperature records near stream and river monitoring sites were provided by the US Historical Climatology Network (USHCN). These data were selected www.frontiersinecology.org because of the quality-control procedures used to adjust for changes in measurement techniques, time of observation bias, and variation due to station relocation (eg Brazel et al. 2000). Historical patterns were investigated for annual average urban heat-adjusted mean temperatures that were estimated and provided by USHCN. All measurements of air temperature were made available through 2005. The time series varied in length, but many of the historical air temperature records spanned over 100 years at many of the stream and river monitoring locations in the present study. Further detailed description of datasets and methodology in trend analysis is available in the Web-only material. n Results Significant linear increases in historical water temperatures were observed for 20 of the 40 streams and rivers analyzed (P < 0.05; Table 1; Figure 1). The longest record of increase (over 90 years) was observed for the Hudson River at Poughkeepsie, New York (P < 0.05). The most rapid rate of increase – of 0.077˚C yr–1 – was recorded for the © The Ecological Society of America SS Kaushal et al. Rising stream and river temperatures Table 1. Results from linear regression analysis of long-term temperature trends in streams and rivers of the US Stream and river Geographic location Record of observation Rate of increase (˚C yr–1) Northeastern US † Hubbard Brook Watershed 3 (hydrologic reference watershed) Hudson River Delaware River Delaware River Delaware River Delaware River above Lackawaxen River Delaware River at Ben Franklin Bridge Delaware River Delaware River Brandywine Creek Pohopoco Creek Pohopoco Creek Gunpowder River at Pretty Boy Reservoir Patapsco River at Liberty Reservoir Potomac River Patuxent River Woodstock, NH Poughkeepsie, NY Harvard, NY Hale Eddy, NY Callicoon, NY Barryville, NY Philadelphia, PA Chester, PA Reed Island Jetty, DE Chadds Ford, PA Perryville, PA Kresgeville, PA Near Baltimore, MD Near Baltimore, MD Washington, DC Solomons, MD 1966–2006 1908–2006 1979–2007 1986–2007 1976–2007 1976–2007 1965–2007 1965–2007 1972–2007 1972–2007 1969–2004 1969–2003 1983–2007 1983–2007 1922–2006 1938–2006 –0.005 0.009 0.021 0.040 0.017 0.024 0.059 0.077 0.013 0.070 –0.020 0.004 0.059 –0.018 0.046 0.022 0.5004 < 0.05* 0.2784 0.1386 0.1982 0.0771 < 0.05* < 0.05* 0.2958 < 0.05* 0.0729 0.7039 < 0.05* 0.4480 < 0.05* < 0.05* Southeastern US Jackson River Hyco Creek Reedy Creek Coosa River Conasauga River Hot Springs,VA Leasburg, NC Vineland, FL State line, AL/GA Tilton, GA 1979–2003 1988–2007 1978–2007 1977–2007 1976–2006 –0.103 0.021 0.041 0.031 0.020 < 0.05* 0.5326 < 0.05* 0.2483 0.0932 Midwestern US White River Skunk River Des Moines River Centerton, IN Augusta, IA Saylorville, IA 1976–2007 1976–2007 1962–2004 –0.121 0.040 0.027 0.7083 < 0.05* < 0.05* Western US Arkansas River Colorado River Dolores River Flathead River Madison River Missouri River Fir Creek North Santiam River Rogue River Bull Run River North Fork Bull Run River South Fork Bull Run River Rogue River at Dodge Bridge Blue River South Santiam River Tuolumne River Pueblo, CO Cisco, UT Cisco, UT Columbia Falls, MT McAllister, MT Toston, MT Brightwood, OR Niagara, OR McLeod, OR Multnomah Falls, OR Multnomah Falls, OR Multnomah Falls, OR Eagle Point, OR Blue River, OR Foster, OR La Grange, CA 1988–2007 1950–2004 1950–2003 1979–2007 1978–2007 1978–2007 1978–2007 1979–2007 1979–2007 1978–2007 1979–2007 1979–2007 1979–2007 1979–2007 1979–2007 1973–2007 0.037 0.034 0.007 0.046 0.025 0.032 0.021 0.021 0.030 0.019 0.009 0.019 0.021 –0.038 0.000 –0.019 < 0.05* < 0.05* 0.4793 < 0.05* < 0.05* < 0.05* < 0.05* < 0.05* < 0.05* 0.0789 0.3400 0.0887 < 0.05* < 0.05* 0.9768 0.1428 P value Notes: *denotes significance at P < 0.05. Results from comparative statistical analyses using non-parametric Mann-Kendall trend test and Sen’s slope estimates for entire available long-term records are also found in WebTable 2. †Although we present statistical analyses for the entire long-term records here, there was a significant (P < 0.05) linear increase in stream temperature since 1980 at Hubbard Brook Experimental Forest and some other sites. Delaware River near Chester, Pennsylvania, and there was also a significant increase (P < 0.05) for the Delaware River at the Ben Franklin Bridge near Philadelphia, Pennsylvania. Interestingly, not all sites along the Delaware River showed significant increases, and sites showing the most rapid rates of increase were located in downstream urban areas. Similarly, the Potomac River outside urban Washington, DC, (a major metropolitan area) showed a rapid rate of increase of 0.046˚C yr–1 (P < 0.05). The nearby Patuxent River showed a lower, long-term increase of 0.022˚C yr–1 at © The Ecological Society of America its rural confluence with the Chesapeake Bay (P < 0.05). There were also significant increases (P < 0.05) observed for streams and rivers in the southeastern, midwestern, and western regions of the US, although rates of increase were typically lower than those observed for the more urban areas of the mid-Atlantic US, including sites along the Delaware, Potomac, and Patapsco rivers, and Brandywine Creek. Hubbard Brook Experimental Forest did not show a statistically significant increase over its entire record (P > 0.05), but there was a significant increasing trend of 0.038˚C yr–1 www.frontiersinecology.org 463 Rising stream and river temperatures SS Kaushal et al. 464 Annual average urban heat-adjusted mean temperature (˚C) Near Poughkeepsie, New York Near Philadelphia, Pennsylvania 12 10 8 16 14 14 12 12 10 r2 = 0.41 P < 0.05 6 2 0 1919 1934 1949 1964 1979 6 4 4 2 2 1864 1879 1894 1909 1924 1939 1954 1969 1 984 1999 1994 Near Baltimore, Maryland Annual average urban heat-adjusted mean temperature (˚C) 0 1894 1909 1924 1939 Year Year 1954 1969 1984 1999 Year Near Vineland, Florida 18 Near Augusta, Iowa 14 25 16 12 20 14 10 12 r2 = 0.33 P < 0.05 15 10 r2 = 0.34 P < 0.05 8 6 8 r2 = 0.09 P < 0.05 6 10 4 4 5 2 2 0 1890 1905 1920 1935 1950 1965 1980 1995 0 1890 Year 0 1905 1920 1935 1950 1965 1980 1995 1890 Year Near Pueblo, Colorado Annual average urban heat-adjusted mean temperature (˚C) 8 6 0 1904 r2 = 0.32 P < 0.05 10 r2 = 0.51 P < 0.05 8 4 1889 Near Washington, DC 16 12 14 Near McAllister, Montana 12 10 12 10 8 10 8 r = 0.24 P < 0.05 6 1935 1950 1965 1980 1995 Near Multnomah Falls and Brightwood, Oregon r2 = 0.39 P < 0.05 8 6 r2 = 0.31 P < 0.05 4 4 6 4 2 2 0 0 1890 1920 Year 14 2 1905 1905 1920 1935 1950 1965 1980 1995 2 1907 1917 1927 1937 1947 1957 1967 1977 1987 1997 Year Year 0 1901 1911 1921 1931 1941 1951 1961 1971 1981 1991 2001 Year Figure 2. Examples of long-term trends in historical air temperatures provided by the US Historical Climatology Network (USHCN) near some of the stream and river monitoring sites (linear regression). in water temperature from 1980 to 2007. Only two sites, the Jackson River, in Hot Springs, Virginia, and the Blue River, in Blue River, Oregon, showed a significant decrease (P < 0.05) in historical water temperatures. The Blue River site was downstream of a dam (WebTable 2). Significant linear increases in historical annual mean air temperature were observed at many USHCN stations located near the long-term temperature monitoring locations for streams and rivers (Figure 2). n Discussion Rising stream and river temperatures Despite differences in environmental conditions across monitoring sites, there appeared to be consistent long-term warming trends in a considerable proportion of the streams and rivers that were analyzed; we observed only two significant long-term decreasing trends in historical temperatures. www.frontiersinecology.org Stream temperature can be an integrator of multiple climatic, hydrologic, and land-use/land-cover factors in watersheds; these factors include groundwater inputs, geography, air temperature, and solar radiation (Webb and Nobilis 2007). Stream temperature can also be influenced by increasing human disturbances, such as global warming, deforestation, urbanization, damming, and thermal discharges (Kinouchi 2007; Nelson and Palmer 2007). Natural and human factors may have contributed to the presence of long-term trends and differences in rates of increase. Similar ranges in long-term warming trends have been reported from individual case studies in streams and rivers worldwide, but an analysis of multiple temperature trends in US streams and rivers is currently lacking (WebTable 1). Ecological and environmental implications Increasing water temperatures in streams and rivers may contribute to serious long-term ecological and environmen© The Ecological Society of America SS Kaushal et al. tal impacts. Warming of streams and rivers can alter community biodiversity, contribute to local species extinctions, and may facilitate the invasion of alien species (eg Peterson and Kwak 1999). Macroinvertebrate abundance has been projected to decline by 21% for every 1˚C rise in water temperature in some areas of the UK, with the greatest risks experienced by sensitive taxa (Durance and Ormerod 2007). Increases in temperature can also disrupt seasonal timing of spawning and larval development (Schindler et al. 2005) and influence spatial distribution and abundance of species (Caissie 2006); for example, combined increases in water temperature and solar radiation have been shown to contribute to a decline in larval abundance of salamanders and increased algal blooms in a forest stream in New Hampshire (Burton and Likens 1973). Changes in water temperatures may also alter stream metabolism, rates of nutrient cycling, and reduce dissolved oxygen concentrations (Caissie 2006). In addition, increases in water temperature can amplify the toxicity of certain environmental contaminants (Rehwoldt et al. 1972). Analyses of empirical historical temperature data will be necessary to improve our ability to forecast future changes in temperature and the ecological effects on streams and rivers. Effects of global warming on stream temperatures The effects of global warming on increasing temperatures at the Earth’s surface are unequivocal (IPCC 2007). For the next two decades, a warming trend of about 0.2˚C per decade is projected for a range of projected emissions scenarios (IPCC 2007). Confidence in short-term warming predictions can be gained from previous predicted global average temperature increases of between 0.15 and 0.3˚C per decade since the IPCC’s first report in 1990, as compared with observed values of 0.2˚C per decade from 1990–2005 (IPCC 2007). At many sites, long-term increases in water temperatures of streams and rivers typically coincided with historical increases in annual mean air temperatures. Air temperature has been shown to be a very strong predictor of water temperature in streams and rivers (Webb and Nobilis 2007). Long-term shifts in large-scale climate oscillations (eg North Atlantic Oscillation) may also influence rates of stream and river warming in some regions (Durance and Ormerod 2007). There may have been some long-term oscillatory behavior in some of the time series, and it would be worth examining a constrained linear model to allow combination of disparate datasets and evaluate rates of long-term temperature increase. As discussed previously, many factors, including hydrology, land use/land cover, and climate change, can influence trends in historical water temperatures. A comprehensive analysis for all the factors that influence water temperatures is not possible at all sites; human-accelerated environmental changes may be co-occurring (Likens 1991) and the simultaneous effects of climate and land-use change on water temperatures need to be considered. For some rivers, such as the Hudson © The Ecological Society of America Rising stream and river temperatures River, there has been no statistical change in stream flow, and no increase in urbanization (in fact, there has been an increase in forest cover), but there has been an increase in historical water temperatures coinciding with increases in historical air temperatures observed for this region (Burns et al. 2007). Other streams and rivers flowing through urban landscapes may have been influenced by the simultaneous heat effects of climate change and land-use change (Brazel et al. 2000; Kalnay and Cai 2003). Interactive effects of global warming and urbanization We observed the most rapid rates of increase in water temperatures in streams and rivers near urban areas of the midAtlantic US (eg the large metropolitan areas of Philadelphia, Pennsylvania; Baltimore, Maryland; and Washington, DC). An exception was the lower but significant rate of increase at the Patuxent River, a rural site located near the Chesapeake Bay (described in the Webonly material). Increasing urbanization and the spread of impervious surfaces can substantially impact runoff and water quality in streams and rivers (eg Kaushal et al. 2005, 2008). “Urban heat island” effects can also increase air temperatures (Brazel et al. 2000), and urbanization and other land-use changes account for an increase in mean air temperature of 0.27°C in the US over the previous century (Kalnay and Cai 2003). For example, there can be substantial differences in water temperatures in streams of similar sizes located across an urban-to-rural gradient at the National Science Foundation-supported Baltimore Ecosystem Study Long Term Ecological Research (LTER) site (WebFigure 1). These increases in stream temperatures correspond with local increases in surface temperature due to urbanization (Brazel et al. 2000). Other interactive anthropogenic disturbances also probably contribute to increased water temperatures in urban areas. These include loss of riparian canopy cover and stream shading (Burton and Likens 1973), increased thermal discharges (Kinouchi 2007), stream and river impoundments (Webb and Nobilis 1995), and heated urban runoff from paved areas (Nelson and Palmer 2007). For example, large “surges” in stream temperatures are associated with urban runoff from hot pavements in watersheds of the Baltimore Ecosystem Study LTER site (WebFigure 1). This effect may contribute to the extreme variability in stream temperatures, in addition to the overall warming effects. In Europe, anthropogenic impacts at the watershed scale have played an important role in raising the temperature of rivers over the past 90 years; such impacts have included increases in effluent discharges and damming of streams and rivers, in addition to climate change (Webb and Nobilis 1995). In Japan, there has been a 34-year increase in the temperature of wastewater effluent as a result of domestic heating of water and energy use, in addition to the interactive effects of global warming (Kinouchi 2007). The expected worldwide increase in www.frontiersinecology.org 465 Rising stream and river temperatures 466 urbanization in many stream and river basins (eg Grimm et al. 2008 in conjunction with the interactive effects of climate change) will lead to a major increase in the amount of heat discharged into streams and rivers. Reduced warming of streams and rivers Ultimately, a substantial reduction in greenhouse-gas emissions is necessary to slow and reverse the effects that climate change will have on streams and rivers. Because it will be difficult to reverse warming trends within the next 100 years (IPCC 2007; Solomon et al. 2009), additional strategies are needed to mitigate the potentially harmful interactive effects of global warming and increasing urbanization. A reduction in watershed coverage by impervious surfaces, an increase in urban tree canopy, shaded stormwater retention wetlands, and stream/riparian conservation and restoration strategies could have the potential to buffer harmful temperature surges in small streams draining urbanizing watersheds (eg Peterson and Kwak 1999). Increased conservation and restoration of riparian buffer width and trees can increase shading, cool the land’s surface by evapotranspiration, and decrease conduction of heat from terrestrial environments to streams, rivers, and lakes (eg Burton and Likens 1973). Enhancing hyporheic exchange (subsurface mixing between surface water and adjacent shallow groundwater) and different wastewater treatment strategies may also be effective in reducing temperatures by stimulating heat exchange with the atmosphere, subsurface groundwater and substrate, and/or the ground surface. A decrease in water withdrawals as a result of improved conservation measures can reduce warming behind impoundments (Webb and Nobilis 1995) and the reuse of treated wastewater may reduce effluent volumes and temperature (Kinouchi 2007). Given that urbanization effects may be considerable in the future (Grimm et al. 2008), managing the interactive effects of climate change and land-use change on water quantity and quality will be critical (eg Nelson and Palmer 2007; Kaushal et al. 2008). More experimental and manipulative work is needed, to detail the empirical effects of climate change, land-use change, and watershed-restoration strategies on stream and river temperatures and ecosystem functions (such as stream metabolism, denitrification, and nutrient cycling). In addition, modeling and forecasting using available historical empirical data may help improve predictions of future interactive effects of global warming and urbanization on increases in stream and river temperatures and heat fluxes to downstream receiving waters. n Acknowledgements M Palmer provided helpful comments. Research was supported by NSF DBI 0640300, Maryland Sea Grant SA7528085-U, NSF LTER DEB-9714835, NSF DEB 0454001. Data were provided by: J Cole and MLP (Hudson River), GEL (NSF supported LTER and LTREB at HBEF), NAJ (Potomac River), KTB (BES LTER), W Stack (Gun www.frontiersinecology.org SS Kaushal et al. Powder and Patapsco River), DHS and RLW (Patuxent River), and all additional sites (USGS). D Buso assisted with and managed field measurements at Hubbard Brook Experimental Forest. R Utz provided watershed information. This paper is scientific contribution number 4338 from the University of Maryland Center for Environmental Science. n References Ashizawa D and Cole JJ. 1994. Long-term temperature trends for the Hudson River: a study of the historical data. Estuaries 17: 166–71. Brazel A, Selover N, Vose R, and Heisler G. 2000. The tale of two climates – Baltimore and Phoenix urban LTER sites. Clim Res 15: 123–35. Burns DA, Klaus J, and McHale MR. 2007. Recent climate trends and implications for water resources in the Catskill Mountain region, New York, USA. J Hydrol 336: 155–70. Burton TM and Likens GE. 1973. Effect of strip-cutting on stream temperatures in Hubbard Brook Experimental Forest, New Hampshire. BioScience 23: 433–35. Caissie D. 2006. The thermal regime of rivers: a review. Freshwater Biol 51: 1389–1406. Durance I and Ormerod S. 2007. Climate change effects on upland stream macroinvertebrates over a 25-year period. Glob Change Biol 13: 942–57. Grimm NB, Faeth SH, Golubiewski NE, et al. 2008. Global change and the ecology of cities. Science 319: 756–60. IPCC (Intergovernmental Panel on Climate Change). 2007. Climate change 2007. Synthesis report. A contribution of Working Groups I, II, and III to the Fourth Assessment Report of the Intergovernmental Panel on Climate Change. Cambridge, UK: Cambridge University Press. Kalnay E and Cai M. 2003. Impact of urbanization and land-use change on climate. Nature 423: 528–31. Kaushal SS, Groffman PM, Band LE, et al. 2008. Interaction between urbanization and climate variability amplifies watershed nitrate export in Maryland. Environ Sci Technol 42: 5872–78. doi:10.1021/es800264f. Kaushal SS, Groffman PM, Likens GE, et al. 2005. Increased salinization of fresh water in the northeastern US. P Natl Acad Sci USA 102: 13517–20. Kinouchi T. 2007. Impact of long-term water and energy consumption in Tokyo on wastewater effluent: implications for the thermal degradation of urban streams. Hydrol Process 21: 1207–16. Likens GE. 1991. Human-accelerated environmental change. BioScience 41: 130. Magnuson JJ, Robertson DM, Benson BJ, et al. 2000. Historical trends in lake and river ice cover in the northern hemisphere. Science 289: 1743–46. Nelson K and Palmer MA. 2007. Predicting stream temperature under urbanization and climate change: implications for stream biota. J Am Water Resour As 43: 440–52. Peterson JT and Kwak TJ. 1999. Modeling the effects of land use and climate change on riverine smallmouth bass. Ecol Appl 9: 1391–1404. Rehwoldt R, Menapace LW, Nerrie B, and Allessandrello D. 1972. The effect of increased temperature upon the acute toxicity of some heavy metal ions. Bull Environ Contam Tox 8: 91–96. Schindler DE, Rodgers DE, Scheurell MD, and Abrey CA. 2005. Effects of changing climate on zooplankton and juvenile sockeye salmon growth in southwestern Alaska. Ecology 86: 198–209. Solomon S, Plattner G-K, Knutti R, and Friedlingstein P. 2009. Irreversible climate change due to carbon dioxide emissions. P Natl Acad Sci USA 106: 1704–09. Webb BW and Nobilis F. 1995. Long-term water temperature trends in Austrian rivers. Hydrolog Sci J 40: 83–96. Webb BW and Nobilis F. 2007. Long-term changes in river temperature and the influence of climatic and hydrologic factors. Hydrol Sci 52: 74–85. © The Ecological Society of America
