Elements of Overall Trade-Distorting Support and Implications of US Subsidy... Kimberly Elliott Center for Global Development and Institute for International Economics
advertisement
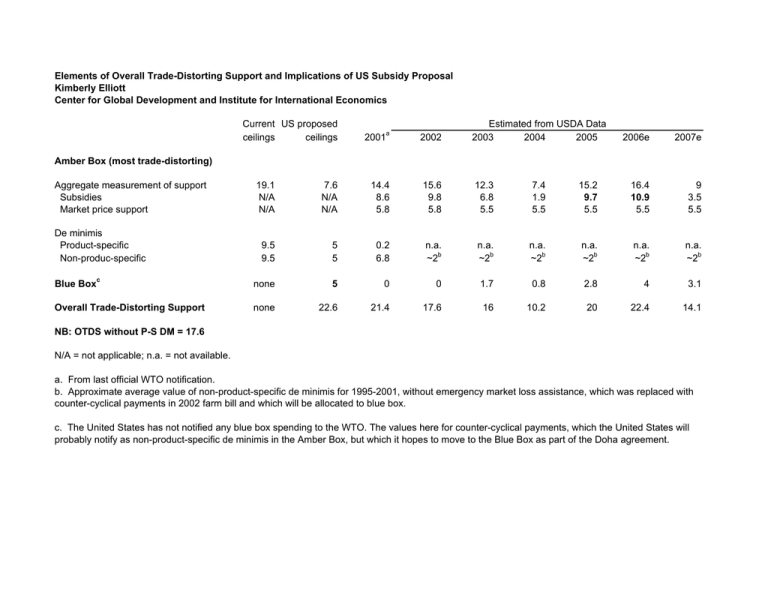
Elements of Overall Trade-Distorting Support and Implications of US Subsidy Proposal Kimberly Elliott Center for Global Development and Institute for International Economics Current US proposed ceilings ceilings a 2002 Estimated from USDA Data 2003 2004 2005 2001 2006e 2007e Amber Box (most trade-distorting) Aggregate measurement of support Subsidies Market price support 19.1 N/A N/A 7.6 N/A N/A 14.4 8.6 5.8 15.6 9.8 5.8 12.3 6.8 5.5 7.4 1.9 5.5 15.2 9.7 5.5 16.4 10.9 5.5 9 3.5 5.5 9.5 9.5 5 5 0.2 6.8 n.a. ~2b n.a. ~2b n.a. ~2b n.a. ~2b n.a. ~2b n.a. ~2b Blue Boxc none 5 0 0 1.7 0.8 2.8 4 3.1 Overall Trade-Distorting Support none 22.6 21.4 17.6 16 10.2 20 22.4 14.1 De minimis Product-specific Non-produc-specific NB: OTDS without P-S DM = 17.6 N/A = not applicable; n.a. = not available. a. From last official WTO notification. b. Approximate average value of non-product-specific de minimis for 1995-2001, without emergency market loss assistance, which was replaced with counter-cyclical payments in 2002 farm bill and which will be allocated to blue box. c. The United States has not notified any blue box spending to the WTO. The values here for counter-cyclical payments, which the United States will probably notify as non-product-specific de minimis in the Amber Box, but which it hopes to move to the Blue Box as part of the Doha agreement.
