cus tomer c ase s tudy
DePauw University Sorts Out Student Data Using Tableau
A few years after Bill Tobin took over as Director of Institutional Research for DePauw University in
Indiana, the school went through a massive administration system upgrade. With the help of
Tableau, Tobin was equal to the challenge.
DePauw’s immediate need was to take the student metrics, enrollment, peer groups, and financials
from their Oracle database, and visualize it all in a way that would help them make strategic plans.
Tobin’s other equally important challenge was to make the data available to the people who could
use it. That meant the data must be “accessible to people who don’t work with it all the time.” Tobin
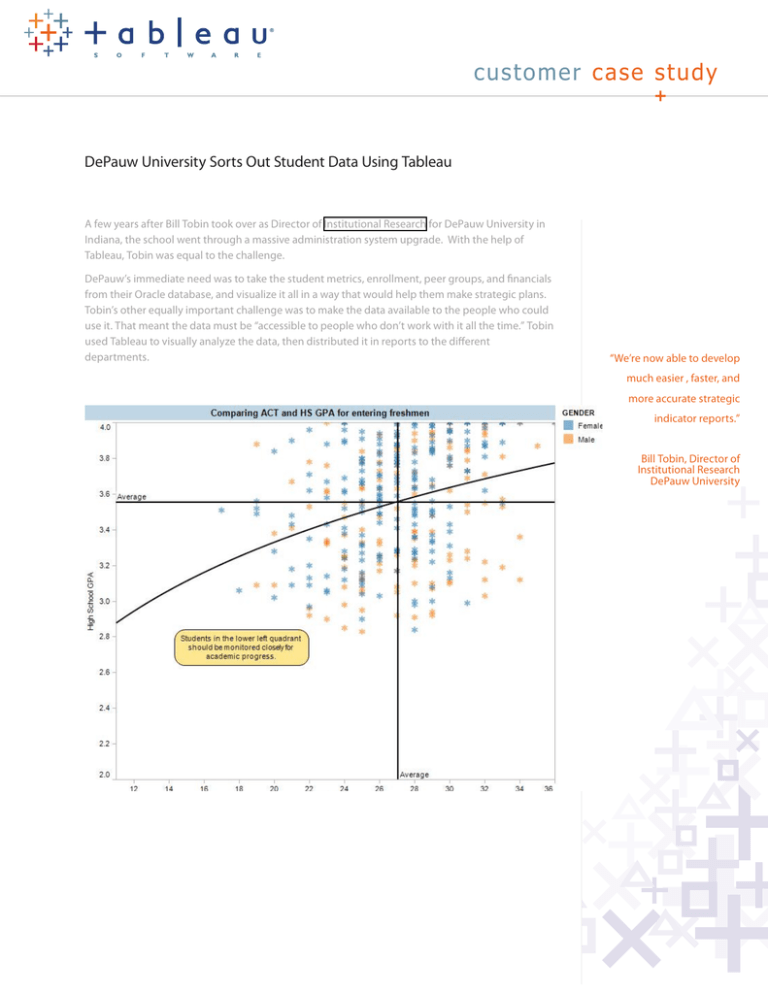
used Tableau to visually analyze the data, then distributed it in reports to the different
departments.
“We’re now able to develop
much easier , faster, and
more accurate strategic
indicator reports.”
Bill Tobin, Director of
Institutional Research
DePauw University
“Truly Strategic Planning” in Less Time
Sorting out the student demographic data was only the starting point. Once he did that, Tobin used
Tableau to facilitate their beginning-of-the-year reporting needs. Tobin explains that before
Tableau there was very large strategic indicator report that needed to be produced. “It took weeks,
it was just a major undertaking bringing in disparate reports from the various departments and
divisions!” Now DePauw is able to apply 20 very strategic indicators to give the University Board a
sense of where they are with enrollment, peer groups, and financials. “The entire thing is done in
Tableau,” said Tobin. The weeks-long “nightmare” is now down to half a day’s work. “We can clearly
show the Board projections by switching the comparison groups, and that allows them to easily
visualize changes.”
Now Tobin uses Tableau to create a “truly strategic planning document.” When looking at the data he
says “it’s no longer a question of making the data accessible, now it’s more like let’s play, let’s ask
questions!” He recalls the morning a senior advisor to the president came down and started asking
him questions off the top of his head. Tobin opened Tableau. The senior advisor was clearly
impressed: “Can we do that by gender? Ethnicity? Home state? Can we see average SAT score? This is
great!”
Importantly, in addition to the immediate ROI impact of cutting out weeks of time previously
invested in the STI, Tobin says he is now able to explore student data easily, and without writing
code. “I’m in it every day. I’ve connected right to our Oracle tables, I’ve got live data!”
“It’s no longer a question of
making the data accessible,
now it’s more like lets play ,
let’s ask questions!”
Bill Tobin, Director of
Institutional Research
DePauw University
Tobin is happy to report “We’re now able to develop much easier, faster and more accurate strategic
indicator reports.”
IPEDS, Grades, Class Schedules and Alumni
Today, DePauw uses Tableau for everything from student data to analyzing peak periods in class
schedules. The school has also found Tableau to be an essential tool for grades, as it allows them to
very quickly verify and filter data. And DePauw uses Tableau for its Integrated Postsecondary
Educational Data System (IPEDS) reporting. With Tableau they can set up a report that’s exactly in
the IPEDS format so it completely simplifies the reporting.
“Another thing I did”, Tobin recalls, “was an alumni map. I did this for our Alumni people, as a matter
of fact they thought this was so great they ran it down to Kinko’s and had a big poster made up!”
Copyright 2009 Tableau Software, Incorporated. All rights reserved. Tableau Software, the Tableau Software logo, and Visual Analysis for Databases are either registered trademarks or trademarks
of Tableau Software, Incorporated. Other company or product names may be the trademarks of their respective owners.


