Using Twitter uring an Academic Conference: The #iswc2009 and Stefan Decker
advertisement
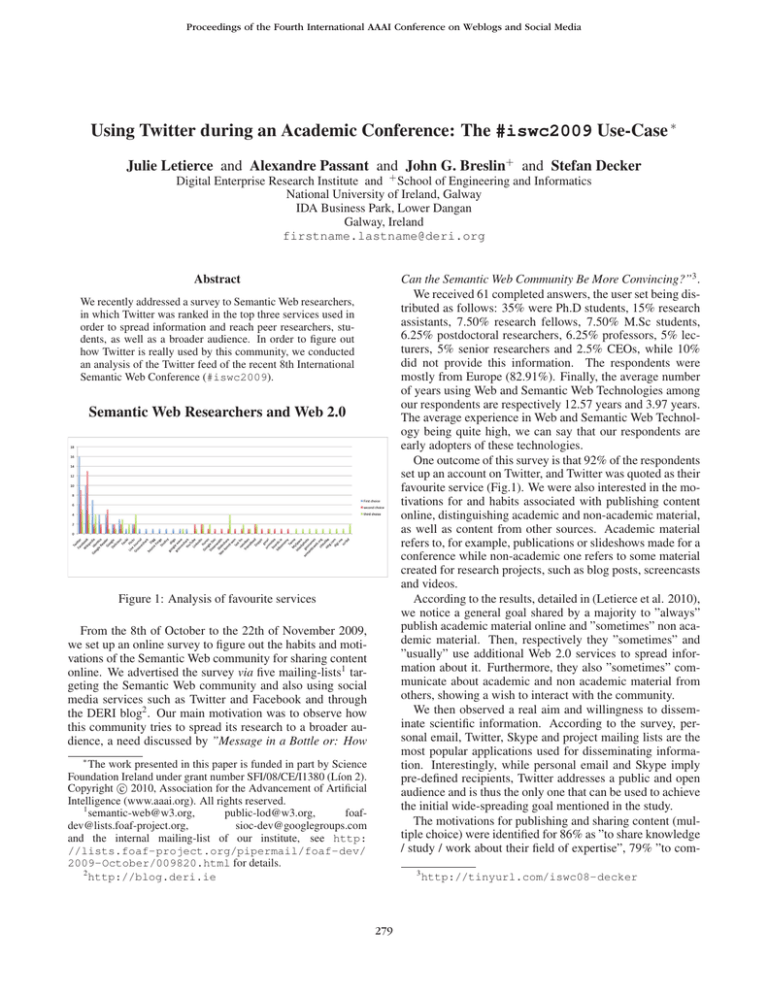
Proceedings of the Fourth International AAAI Conference on Weblogs and Social Media Using Twitter d uring an Academic Conference: The #iswc2009 Use-Case ∗ Julie Letierce and Alexandre Passant and John G. Breslin+ and Stefan Decker Digital Enterprise Research Institute and + School of Engineering and Informatics National University of Ireland, Galway IDA Business Park, Lower Dangan Galway, Ireland firstname.lastname@deri.org Can the Semantic Web Community Be More Convincing?”3 . We received 61 completed answers, the user set being distributed as follows: 35% were Ph.D students, 15% research assistants, 7.50% research fellows, 7.50% M.Sc students, 6.25% postdoctoral researchers, 6.25% professors, 5% lecturers, 5% senior researchers and 2.5% CEOs, while 10% did not provide this information. The respondents were mostly from Europe (82.91%). Finally, the average number of years using Web and Semantic Web Technologies among our respondents are respectively 12.57 years and 3.97 years. The average experience in Web and Semantic Web Technology being quite high, we can say that our respondents are early adopters of these technologies. One outcome of this survey is that 92% of the respondents set up an account on Twitter, and Twitter was quoted as their favourite service (Fig.1). We were also interested in the motivations for and habits associated with publishing content online, distinguishing academic and non-academic material, as well as content from other sources. Academic material refers to, for example, publications or slideshows made for a conference while non-academic one refers to some material created for research projects, such as blog posts, screencasts and videos. According to the results, detailed in (Letierce et al. 2010), we notice a general goal shared by a majority to ”always” publish academic material online and ”sometimes” non academic material. Then, respectively they ”sometimes” and ”usually” use additional Web 2.0 services to spread information about it. Furthermore, they also ”sometimes” communicate about academic and non academic material from others, showing a wish to interact with the community. We then observed a real aim and willingness to disseminate scientific information. According to the survey, personal email, Twitter, Skype and project mailing lists are the most popular applications used for disseminating information. Interestingly, while personal email and Skype imply pre-defined recipients, Twitter addresses a public and open audience and is thus the only one that can be used to achieve the initial wide-spreading goal mentioned in the study. The motivations for publishing and sharing content (multiple choice) were identified for 86% as ”to share knowledge / study / work about their field of expertise”, 79% ”to com- Abstract We recently addressed a survey to Semantic Web researchers, in which Twitter was ranked in the top three services used in order to spread information and reach peer researchers, students, as well as a broader audience. In order to figure out how Twitter is really used by this community, we conducted an analysis of the Twitter feed of the recent 8th International Semantic Web Conference (#iswc2009). Semantic Web Researchers and Web 2.0 Figure 1: Analysis of favourite services From the 8th of October to the 22th of November 2009, we set up an online survey to figure out the habits and motivations of the Semantic Web community for sharing content online. We advertised the survey via five mailing-lists1 targeting the Semantic Web community and also using social media services such as Twitter and Facebook and through the DERI blog2 . Our main motivation was to observe how this community tries to spread its research to a broader audience, a need discussed by ”Message in a Bottle or: How ∗ The work presented in this paper is funded in part by Science Foundation Ireland under grant number SFI/08/CE/I1380 (Lı́on 2). c 2010, Association for the Advancement of Artificial Copyright Intelligence (www.aaai.org). All rights reserved. 1 semantic-web@w3.org, public-lod@w3.org, foafdev@lists.foaf-project.org, sioc-dev@googlegroups.com and the internal mailing-list of our institute, see http: //lists.foaf-project.org/pipermail/foaf-dev/ 2009-October/009820.html for details. 2 http://blog.deri.ie 3 279 http://tinyurl.com/iswc08-decker municate about some of their research projects”, 52% ”to increase their network” (9.6% did not give any answer). In addition, regarding the academic and non-academic material, 8.6% of the respondents answered ”because it is compulsory (project guidelines, research centre / university policy...)”. Moreover, 46.8% of the respondents share content from other sources ”to communicate about venues (conference, workshops, tutorial, talk, etc.)”. Finally, whatever the type of content published or the type of application chosen, researchers want to reach in priority their own community (88.6%), followed by students (52.2%), technical audiences (50.41%), general audience (45.9%), and business audience (29.3%), while 4.5% do not know which audience they want to reach. According to the survey, in majority, researchers from the Semantic Web community set up an account on Twitter and use it to spread scientific information to reach different communities, as well as their peers than a broader audience. Lots of different communities can be found on Twitter, meaning that researchers can potentially reach several audiences as expected. Consequently, Twitter might be a relevant service for the community to spread scientific information to broader audiences. Therefore, we were interested in analysing how this particular community uses Twitter, considering tagging habits, replies, etc., in order to figure out if their tweets could reach this expected audience. We targeted a scientific conference, since it gives a particular timeline when such scientific content can be shared on Twitter. In particular, we analysed the usage of Twitter during ISWC 2009, the major academic venue for the Semantic Web community4 . From October 24th to November 4th, we crawled - every minute - all messages tagged #iswc2009, since this hashtag was officially announced in the conference brochure, leading to a total of 1444 distinct tweets5 . Therefore, our dataset is composed exclusively of tweets tagged with the official #iswc2009 tag, meaning that we did not captured other tweets speaking about the event if there were tagged e.g. #iswc, #iswc09, or without any tag patterns. An official account (@iswc2009) was set up but only one update was made (in April) to disseminate the website URL and the conference did not provide live stream. We then believe that we captured tweets coming from users’ desire to spread information, e.g. to relay knowledge gained during keynotes or presentations by simultaneously posting tweets about these talks. nodes as soon as their is a message from one user to another. We created a similar graph considering only users that have two connections (directed replies) or more, the network then being notably more sparse. Figure 2: (left) Replies network with one connecting reply and (right) a minimum of two replies connecting users We also analysed (1) the distribution of tweets per user, that follows a power law (Fig.3) and; (2) the hubs and authorities of the network, using the HITS algorithm (Tab.1), hubs being user who address lots of @reply messages, and authorities the ones that receive tweets from others. We hence identified that some users such as @juansequada and @tommyh have both higher hub and authority score, when others such as @novaspivack, invited speaker at the conference, have an high authority but a lower hub value. Tom Heath alias @tommyh was the Semantic Web in Use Chair of the conference and Juan Sequeda alias @juansequada the organiser of the Linked-a-thon during the conference. Interestingly, we notice that people who have authority into the community (such as @timberners_lee) or during an event (as organiser or keynote speaker for instance) get also a virtual authority on Twitter. Furthermore, those who have both a high authority and a high hub level are more likely to be people physically involved in the event. 100 80 Users 60 40 Characteristics of the Dataset We identified 273 distinct users in the dataset. First, we have been interested in understanding the interactions between them. To measure this, we focused on their conversational habits (via the @user syntax) and build a graph of conversation patterns (Fig.2), a directed edge being present between 20 0 0 20 40 60 80 100 120 140 Tweets 4 ISWC 2009 was held in Washington DC from October 25th to 29th http://iswc2009.semanticweb.org/. 5 Twitter was the primary microblogging platform used by attendees; by way of contrast, Identi.ca had just 40 messages tagged with #iswc2009. Figure 3: Distribution of tweets per users To determine the distribution of messages in our dataset, 280 Users juansequeda novaspivack tommyh ldodds johnbreslin jahendler timberners lee Authority 0.056701 0.049289 0.048854 0.038058 0.036076 0.026929 0.026346 Users tommyh juansequeda johnbreslin jahendler rtroncy kidehen paul houle Hubs 0.051884 0.041556 0.034261 0.032296 0.028231 0.026193 0.022655 1400 1200 1000 800 600 400 200 0 21 10 00:00 Table 1: Hubs and authorities 22 10 00:00 23 10 00:00 24 10 00:00 25 10 00:00 25 10 23:00 26 10 23:00 27 10 23:00 28 10 23:00 29 10 23:00 30 10 23:00 31 10 23:00 Figure 4: Total tweets over time we distinguished tweets from retweets, the dataset being distributed as follows. 80% are original tweets, among them: (1) 34% contain a @user reference; (2) 42% contain a hashtag, excluding #iswc2009, and (3) 31% contain a URL; 16% containing both hashtags and links. In addition, 20% are likely to be retweets as they contain the RT pattern. Among them, (1) 55% contain a URL, and (2) 50% a hashtag; 31% containing both. By having captured all tweets tagged #iswc2009, we studied a determined sample and we noticed that this dataset does not follow a distribution similar to the one observed by (boyd, Golder, and Lotan 2010) in a random sample of 720,000 tweets. Our dataset includes 42% of tweets with hashtags versus 5% observed by boyd and al. and 20% of retweet versus 3% in their sample. Therefore, we noticed that the tweets posted during ISWC 2009, by people who are likely to belong to the same particular community of researchers, were using hashtags and retweeting practises more than in general. We concluded that in addition to spread information, they want to be found by others, through the tags associated to their posts. This tagging habit will be studied in an upcoming section. 6 5 4 3 2 1 14 00 16 00 18 00 20 00 22 0 GMT T me (i e EST + 4) Figure 5: Tweets of a single day (per 2 minutes) Identifying #iswc2009 Topics In order to identify #iswc2009 topics and the way they were discussed, we analysed both the hashtags and the links used in tweets, as both are used to emphasise the key point of a tweet according to whomever posted and tagged it. Thus, first, by studying hashtags, we can figure out what are the key messages that users want to spread via Twitter. As seen previously, our data set reveals that the use of hashtags is much more popular than in general — 42% versus 5% observed by (boyd, Golder, and Lotan 2010), while they also found that 18% of retweets contain a hashtag versus 50% in our dataset. This reveals a strong desire to emphasise particular messages and to be found. In order to identify the type of tags that our users add into their tweets, we identified 7 different categories of hashtags (Tab.2). Interestingly, most of the tags are related to what the content is about, while only a few identify what the content is (”Documentation” category), considering the different roles of tags defined by (Golder and Huberman 2005). The first two categories as well as ”Institute / people” refer to tech- What Happened in D.C. ? Fig.4 shows the timeline of tweets in the dataset. While there have been some messages posted before (e.g. Call for Papers) and after (e.g. links to reports) the conference, that stream let us overview when the conference was held, and at which rhythm. We can see for instance that there were less tweets during the first two days, that were actually workshops and tutorials, while the main conference started on the third day. We also focused on the analysis of a single day, the 29th of October (Figure 5). We can identity three pikes which correspond to particular events: (1) Nova Spivak’s (@novaspivak) keynote in the morning; (2) the New York Times announcement about publishing Linked Data in the afternoon; (3) awards and closing ceremony in the evening. By combining this graph with the associated messages, we can then identify the hot topics and important times and trends of the conference in order to get relevant information from these real-time data stream (Sheth 2009), so that Twitter can be used to give an a posteriori overview a conference. Category Semantic Web terms Events Domains Applications Institute / people Documentation Other % 30% 22% 19% 12% 6% 4% 7% Examples #linkeddata; #sparql #sdow2009; #ldthon #hcls; #gov20 #NYTimes; #twine #isweb; #pathayes #slides; #tutorials #airfrance; #usa Table 2: Hashtags classification 281 nical and community terms and we can then suppose that these tweets are mainly targeted to an audience involved in this area such as researchers. The domains and applications category could however reach a broader audience such as the Health Care (#hcls) or e-Government (#gov20) communities, since users are susceptible to follow the related streams for their own field of expertise, as well as people interested in applications that they already know and follow (e.g. #nytimes), hence enabling the spread of messages outside the initial research community. However, compared to our initial survey observation regarding the will to communicate to students and to a broader audience, the ”Documentation” hashtags were only seldom used. However, when associated with other explicit hashtags, these could have helped users to discover educational content e.g. tutorials, slideshows or videos about specific topics, consequently helping with the spread of technical and scientific messages, which was a goal outlined from the survey. More generally, this distribution shows us that only 4% of hashtags are dedicated towards enhancing learning, while 30% of hashtags are about technical terms. Users seems to use hashtags primarily to underline core topics rather than describe the way in which the message is disseminated (via slideshows, publications, etc.). In the ”Application” category, the #NYtimes tag was the most popular. Indeed during the conference, the New York Times announced that they had started to publish Linked Open Data6 . By analysing our whole dataset, we found that 7% of tweets were about the previous announcement, including 55% of tweets and 45% of retweets. Among them, 52% contains a URL and 62% contains hashtags (excluding #iswc2009). Then, by following the same classification than previously, we identified that 26% of the tags used are related to the New York Times (#NYtimes, #nyt, and #newyorktimes), while, among others, 48% refer to Semantic Web terms such as #linkeddata, #skos, #sparql and 5% only specified the domain, using #semanticweb or #web3. Thus, we observed once again a user behaviour of tagging mostly with terms related to the Semantic Web terminology, the main aspect being to emphasise the technological aspect of this announcement. We then conclude that, from this community, Twitter was used mainly to disseminate the announcement to peer researchers, or at least to people already following the technology. In addition to the tags, we also analysed the links in the dataset. 36% of our posts contains an URL. We then classified the URLs in six categories (Fig.6). The largest category ”Documentation” (34%) contains URLs of blog posts (35%), slideshows (34%), publications (27%), videos (2%) and books (2%). Slideshows and publications are directly related to the ones presented in the event, blog posts are either research posts or ISWC reports and videos are mainly demos about applications presented during the conference. While tweets are majority tags with ”semantic web terms”, most of the links are mainly related to the ”docu6 mentation” category. We then see that even for documentation, users use tags focusing on the content, and not on the type. However, if these tweets, containing learning and documentation material were associated with ”documentation” or ”domains” tags (in addition to the ”semantic web terms”), it would help better the researchers to fulfil their goals of reaching, in addition to their peers, other audiences such as the students and the general public. #$( #!( "!( %( %( $( Figure 6: URLs Classification Conclusion In this short paper, we discussed the motivations of a particular research community (the Semantic Web one) to share its content online and analysed how Twitter was used during a particular conference. Our main outcomes are that on the one hand, one can make sense of Tweets to identify what happen during a conference, and on the other hand that in spite of a general willingness of researchers to spread a message outside their community, their current tagging habits make the messages directed mainly to their peers. Going further, in the future, following the same process we will analyse the use of Twitter during several conferences. In addition to what was presented here, we will also study the retweeted messages, to figure out how far some messages are spread, by whom, and what kind of messages are most likely to be retweeted. We also aim at analysing the correlation between the author of a retweet and its content, in order to figure out the motivation of such practise by scientists. References boyd, D.; Golder, S.; and Lotan, G. 2010. Tweet, Tweet, Retweet: Conversational Aspects of Retweeting on Twitter. In Proceedings of HICSS-43. Kauai, HI. Golder, S., and Huberman, B. A. 2005. The Structure of Collaborative Tagging Systems. Journal of Information Science 32(2):198–208. Letierce, J.; Passant, A.; Breslin, J. G.; and Decker, S. 2010. Understanding how Twitter is used to widely spread Scientific Messages. In Web Science 2010. (To appear). Sheth, A. 2009. Citizen Sensing, Social Signals, and Enriching Human Experience. IEEE Internet Computing 13(14):80–85. http://data.nytimes.com/ 282


