On the role of IR surface emissivity in polar night-time... REMARKS RATIONALE ANALYSIS
advertisement

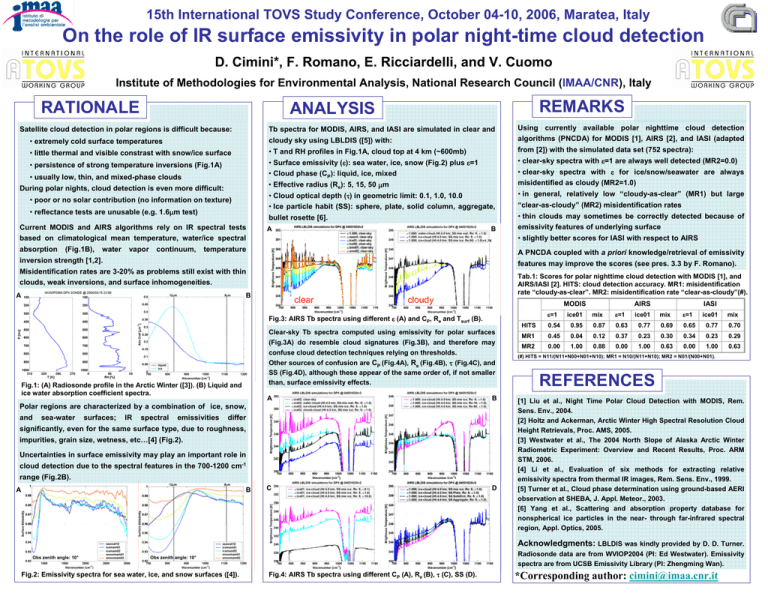
15th International TOVS Study Conference, October 04-10, 2006, Maratea, Italy On the role of IR surface emissivity in polar night-time cloud detection D. Cimini*, F. Romano, E. Ricciardelli, and V. Cuomo Institute of Methodologies for Environmental Analysis, National Research Council (IMAA/CNR), Italy RATIONALE REMARKS ANALYSIS Tb spectra for MODIS, AIRS, and IASI are simulated in clear and Using currently available polar nighttime cloud detection • extremely cold surface temperatures cloudy sky using LBLDIS ([5]) with: algorithms (PNCDA) for MODIS [1], AIRS [2], and IASI (adapted • little thermal and visible constrast with snow/ice surface • T and RH profiles in Fig.1A, cloud top at 4 km (~600mb) from [2]) with the simulated data set (752 spectra): • persistence of strong temperature inversions (Fig.1A) • Surface emissivity (ε): sea water, ice, snow (Fig.2) plus ε=1 • Cloud phase (CP): liquid, ice, mixed • clear-sky spectra with ε=1 are always well detected (MR2=0.0) Satellite cloud detection in polar regions is difficult because: • usually low, thin, and mixed-phase clouds During polar nights, cloud detection is even more difficult: • poor or no solar contribution (no information on texture) • reflectance tests are unusable (e.g. 1.6μm test) Current MODIS and AIRS algorithms rely on IR spectral tests • Cloud optical depth (τ) in geometric limit: 0.1, 1.0, 10.0 • Ice particle habit (SS): sphere, plate, solid column, aggregate, • in general, relatively low “cloudy-as-clear” (MR1) but large bullet rosette [6]. • thin clouds may sometimes be correctly detected because of A B based on climatological mean temperature, water/ice spectral absorption (Fig.1B), water vapor continuum, • clear-sky spectra with ε for ice/snow/seawater are always misidentified as cloudy (MR2=1.0) • Effective radius (Re): 5, 15, 50 μm temperature A PNCDA coupled with a priori knowledge/retrieval of emissivity features may improve the scores (see pres. 3.3 by F. Romano). Misidentification rates are 3-20% as problems still exist with thin Tab.1: Scores for polar nighttime cloud detection with MODIS [1], and AIRS/IASI [2]. HITS: cloud detection accuracy. MR1: misidentification rate “cloudy-as-clear”. MR2: misidentification rate “clear-as-cloudy”(#). clouds, weak inversions, and surface inhomogeneities. A B clear cloudy MODIS Fig.3: AIRS Tb spectra using different ε (A) and CP, Re and Tsurf (B). Clear-sky Tb spectra computed using emissivity for polar surfaces (Fig.3A) do resemble cloud signatures (Fig.3B), and therefore may confuse cloud detection techniques relying on thresholds. Other sources of confusion are CP (Fig.4A), Re (Fig.4B), τ (Fig.4C), and SS (Fig.4D), although these appear of the same order of, if not smaller than, surface emissivity effects. Fig.1: (A) Radiosonde profile in the Arctic Winter ([3]). (B) Liquid and ice water absorption coefficient spectra. A B C D Polar regions are characterized by a combination of ice, snow, sea-water surfaces; emissivity features of underlying surface • slightly better scores for IASI with respect to AIRS +1.7K inversion strength [1,2]. and “clear-as-cloudy” (MR2) misidentification rates IR spectral emissivities differ significantly, even for the same surface type, due to roughness, impurities, grain size, wetness, etc…[4] (Fig.2). Uncertainties in surface emissivity may play an important role in cloud detection due to the spectral features in the 700-1200 cm-1 range (Fig.2B). A B AIRS IASI ε=1 ice01 mix ε=1 ice01 mix ε=1 ice01 mix HITS 0.54 0.95 0.87 0.63 0.77 0.69 0.65 0.77 0.70 MR1 0.45 0.04 0.12 0.37 0.23 0.30 0.34 0.23 0.29 MR2 0.00 1.00 0.88 0.00 1.00 0.63 0.00 1.00 0.63 (#) HITS = N11/(N11+N00+N01+N10); MR1 = N10/(N11+N10); MR2 = N01/(N00+N01). REFERENCES [1] Liu et al., Night Time Polar Cloud Detection with MODIS, Rem. Sens. Env., 2004. [2] Holtz and Ackerman, Arctic Winter High Spectral Resolution Cloud Height Retrievals, Proc. AMS, 2005. [3] Westwater et al., The 2004 North Slope of Alaska Arctic Winter Radiometric Experiment: Overview and Recent Results, Proc. ARM STM, 2006. [4] Li et al., Evaluation of six methods for extracting relative emissivity spectra from thermal IR images, Rem. Sens. Env., 1999. [5] Turner et al., Cloud phase determination using ground-based AERI observation at SHEBA, J. Appl. Meteor., 2003. [6] Yang et al., Scattering and absorption property database for nonspherical ice particles in the near- through far-infrared spectral region, Appl. Optics, 2005. Acknowledgments: LBLDIS was kindly provided by D. D. Turner. Obs zenith angle: 10° Radiosonde data are from WVIOP2004 (PI: Ed Westwater). Emissivity spectra are from UCSB Emissivity Library (PI: Zhengming Wan). Obs zenith angle: 10° Fig.2: Emissivity spectra for sea water, ice, and snow surfaces ([4]). Fig.4: AIRS Tb spectra using different CP (A), Re (B), τ (C), SS (D). *Corresponding author: cimini@imaa.cnr.it


