Integrated Modeling of Physical System Dynamics © Neville Hogan 1994 page 1
advertisement

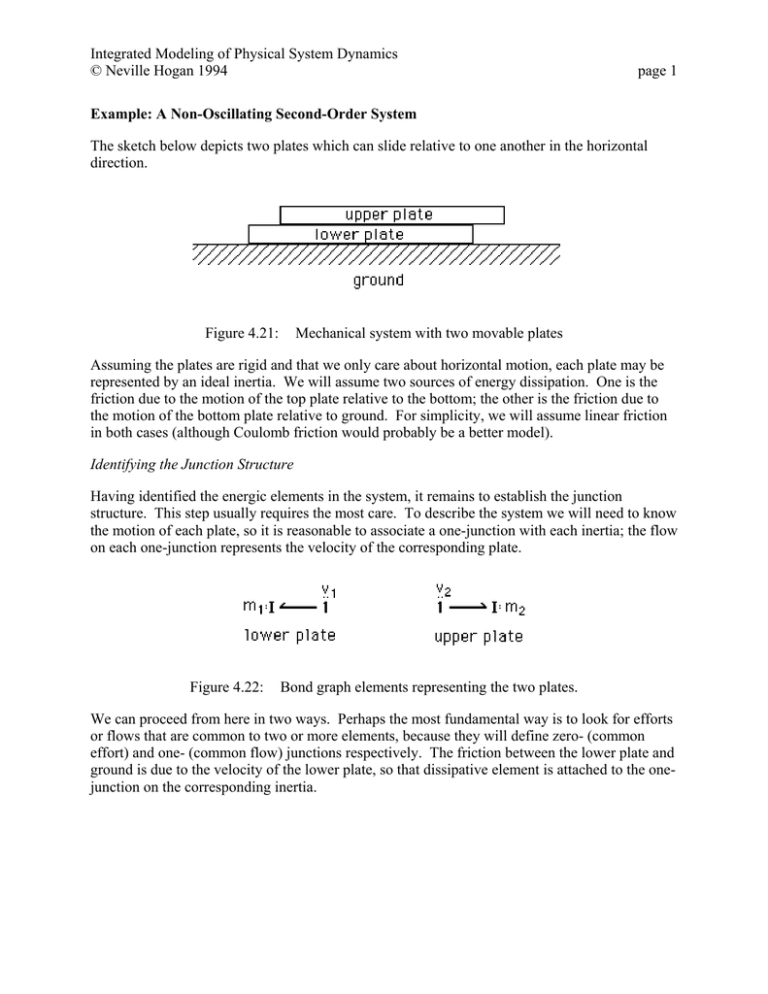
Integrated Modeling of Physical System Dynamics © Neville Hogan 1994 page 1 Example: A Non-Oscillating Second-Order System The sketch below depicts two plates which can slide relative to one another in the horizontal direction. Figure 4.21: Mechanical system with two movable plates Assuming the plates are rigid and that we only care about horizontal motion, each plate may be represented by an ideal inertia. We will assume two sources of energy dissipation. One is the friction due to the motion of the top plate relative to the bottom; the other is the friction due to the motion of the bottom plate relative to ground. For simplicity, we will assume linear friction in both cases (although Coulomb friction would probably be a better model). Identifying the Junction Structure Having identified the energic elements in the system, it remains to establish the junction structure. This step usually requires the most care. To describe the system we will need to know the motion of each plate, so it is reasonable to associate a one-junction with each inertia; the flow on each one-junction represents the velocity of the corresponding plate. Figure 4.22: Bond graph elements representing the two plates. We can proceed from here in two ways. Perhaps the most fundamental way is to look for efforts or flows that are common to two or more elements, because they will define zero- (common effort) and one- (common flow) junctions respectively. The friction between the lower plate and ground is due to the velocity of the lower plate, so that dissipative element is attached to the onejunction on the corresponding inertia. Integrated Modeling of Physical System Dynamics © Neville Hogan 1994 Figure 4.23: page 2 Bond graph of the two plates with friction due to motion relative to ground. Any force exerted on the upper plate is generated by friction between the two plates. Thus the other dissipative element is attached to a zero junction between the two one-junctions and the complete system bond graph is as shown below. Figure 4.24: Bond graph of the two plates with both sources of friction. Two of the bonds in this graph are without half arrows. How can they be chosen? Well, the friction between the two plates acts to transmit energy between the plates. Therefore, it makes reasonable sense to depict power as flowing from one plate to the other, for example, as follows. Figure 4.25: Complete system bond graph with power signs included. But we are being a little glib; the choice of power signs bears closer inspection. Suppose, for some reason, we elected to depict the half arrows as follows: m1 : , v1 1 v2 1 0 v3 b1 : R R:b2 ,: m 2 Integrated Modeling of Physical System Dynamics © Neville Hogan 1994 Figure 4.26: page 3 Complete system bond with alternative power signs. At first glance, this would seem to be equally reasonable. However, a little care is required. The force generated by the friction between the plates is a function of the relative velocity of the plates. But from the signs in the bond graph above, the continuity equation associated with the zero junction would be: v1 + v2 + v3 = 0 (4.103) This would mean that the relative velocity would be expressed as the negative sum of the plate velocities. v3 = -(v1 + v2) (4.104) Can that be right? Strictly speaking, it is not wrong. However, it would require that the direction of positive velocity for one plate be defined as opposite to that for the other plate. The direction of positive velocity is purely a matter of convention and there is nothing physically wrong with doing this, but it would be perverse. Worse, it would be confusing. A much saner approach is to use the same convention for both inertias and use a junction structure which represents the relative velocity correctly. Write down a one-junction for each of the three distinct velocities, v1, v2, and the relative velocity, v3, then add a zero-junction between them. The signs on the bonds should be chosen so that the continuity equation yields the required definition of relative velocity. Figure 4.27: A junction structure which identifies v3 as a relative velocity. Taking the signs into account, the continuity equation for the zero junction is v1 - v2 - v3 = 0 (4.105) Now the relative velocity is the difference of the plate velocities, which makes much better sense. v3 = v1 - v2 (4.106) Following this line of reasoning, a clumsier but surer procedure for identifying the junction structure is as follows. Identify all relevant velocities (including the velocity of the inertial reference frame, vo) and assign a one-junction to each. Next identify all relevant relative velocities and assign a separate one-junction to each of these. Now write an appropriately signed zero-junction which will correctly represent each relative velocity as follows. Integrated Modeling of Physical System Dynamics © Neville Hogan 1994 Figure 4.28: page 4 A junction structure for the two-plate system identifying all relevant velocities. Now it easy to see that the dissipative elements are associated with the relative velocities. The ground is always at zero velocity, (by assumption) independent of what the system does, so attach a flow source to the corresponding one-junction. The inertias go on the remaining onejunctions as before. Figure 4.25: Complete system bond graph with reference velocity explicitly represented. Next simplify this graph by eliminating superfluous elements. If the effort or flow on any bond or element is identically zero, the associated power flow is always zero and the bond may be removed. This eliminates the flow source, the two immediately adjacent bonds and the onejunction between them. If any two-port one- or zero-junction has one half arrow pointing inwards and one pointing outwards, it may be eliminated because both the efforts and the flows on the two bonds are identical. The resulting graph is shown below. It is essentially the same as in figure 4.25. Integrated Modeling of Physical System Dynamics © Neville Hogan 1994 Figure 4.26: page 5 Complete system bond graph after superfluous elements are removed. Aside: There is nothing incorrect about including superfluous elements, but it usually simplifies matters to eliminate them; however, sometimes it is helpful to include a superfluous junction to identify a particular effort or flow. The important point to note here is that choosing the power signs (orienting the half arrows) is an important part of identifying the junction structure. Assigning Causality Next we add causal strokes to the graph. Remember, we want as many energy storage elements as possible to have integral causality. We begin with the inertia of the lower plate. In integral causality, it accepts a force input an determines a velocity as its output. That velocity is the input to the one-junction and therefore determines the causal assignment on the other two bonds of that one-junction as shown in figure 4.27. Figure 4.27: Partial causal assignment for the two-plate system. This is an example of a strong causal assignment. The same velocity is input to the friction between the lower plate and ground (b1) and the zero-junction. But the velocity input to the zero-junction does not uniquely determine the outputs of the zero-junction, and the consequences of this choice of integral causality on the lower inertia do not propagate any further. Thus we are free to choose integral causality for the second inertia. When we do so, the zero junction receives a second velocity input. In this situation, the consequences of this causal choice do propagate through the zero-junction. Two of the three bonds of the zero junction input velocities, therefore the remaining bond must input a force as shown in figure 4.28. This is because something — in this case the friction due to relative motion — must determine the unique effort on the junction. This is an example of a weak causal assignment. Integrated Modeling of Physical System Dynamics © Neville Hogan 1994 Figure 4.28: page 6 Complete causal assignment for the two-plate system. Deriving State Equations To obtain state equations, we begin by choosing state variables. As the energy storage elements give rise to the system's dynamic behavior, we choose variables associated with the independent energy storage elements. In this case, one such choice would be the momenta of the two inertias; they will suffice to define the energy in the system. But remember, state variables are not unique. Another choice would be the velocities of the two inertias. As all elements in this system are linear, we will use the latter. Differentiating the constitutive equations for the inertias and using the differential definitions of momentum, we obtain: dv1/dt = (1/m1) F1 (4.107) dv2/dt = (1/m2) F2 (4.108) Expressions for the forces F1 and F2 are obtained by combining the junction structure equations and the constitutive equations of the dissipative elements. There are numerous ways to write and combine these equations, but we need expressions in causal form, as assignment statements (e.g. equation 4.106 rather than equation 4.105). The required form, complete with correct signs, can be found by reading the equations directly from the half arrows and causal strokes on the bond graph. Thus the causal strokes on the zero junction show that the force F2 is determined solely by the dissipator b2. Subscripting variables in an obvious way: F2 = FR2 = b2vR2 (4.109) The velocity vR2 is determined from the junction structure as follows. vR2 = (v1 - v2) (4.110) Substituting 4.110 into 4.109 into 4.108 yields a state equation. dv2/dt = (1/m2)b2(v1 - v2) (4.111) The causal strokes on the one junction indicate that the force F1 is determined by both dissipators. Again, using obvious subscripts: Integrated Modeling of Physical System Dynamics © Neville Hogan 1994 F1 = -(FR1 + FR2) page 7 (4.112) The dissipator b2 is in resistance causal form. FR1 = b1vR1 = b1v1 (4.113) Substituting 4.110 into 4.109, 4.113 and 4.109 into 4.112, and 4.112 into 4.108 yields another state equation. dv1/dt = -(1/m1)(b1v1 + b2(v1 - v2)) (4.114) Equations 4.114 and 4.111 may be re-written in the standard integrable form x' = Ax. v -(b1 + b2)/m1 d ⎡⎢ 1⎤⎥ ⎡⎢ dt ⎢v ⎥ = ⎢ b2/m2 ⎣ 2⎦ ⎣ b2/m1 ⎤⎡v1⎤ ⎥⎢ ⎥ ⎥⎢ ⎥ -b2/m2 ⎦⎣v2⎦ (4.115) As the system has two independent energy storage elements, it is second order. However, if we examine the system matrix, A, we can see that the off diagonal elements may be unequal but have the same sign. The antisymmetry of signs we found in the harmonic oscillator is absent. That sign antisymmetry was what gave rise to oscillatory behavior and we might expect that this system will not exhibit oscillatory behavior. In fact, this result can be derived formally by integrating the matrix differential equations. In general, energy storage elements of the same type connected by one- and zero-junctions do not give rise to oscillation. Sign Convention for Energy Storage Elements Note that once sign and causality have been determined on the bond graph, equations follow directly. The basic sign convention, that power flow is positive into all passive elements, should not be violated, as it is what allows us to write the constitutive equations of the elements in the usual way. By this sign convention, a positive effort applied to an inertia will cause its flow to increase. In the mechanical domain, a positive force will cause positive acceleration. In contrast, if the half arrow were to point away from the element, this would mean that power was positive out of the element. In the mechanical domain, positive force would cause deceleration, not acceleration. Note the negative sign in the constitutive equation shown in figure 4.29. Figure 4.29: Consequence of power-positive-out convention on an energy-storage element. If you were perverse and were to follow this sign convention consistently, everything would be fine; but being human and therefore prone to error, there's a good chance that you might forget to reverse the sign on the constitutive equations. Don't do it! Stay with the convention that power is positive into a passive element.


