Exam in 732A28 Survey Sampling, 2012-03-21
advertisement
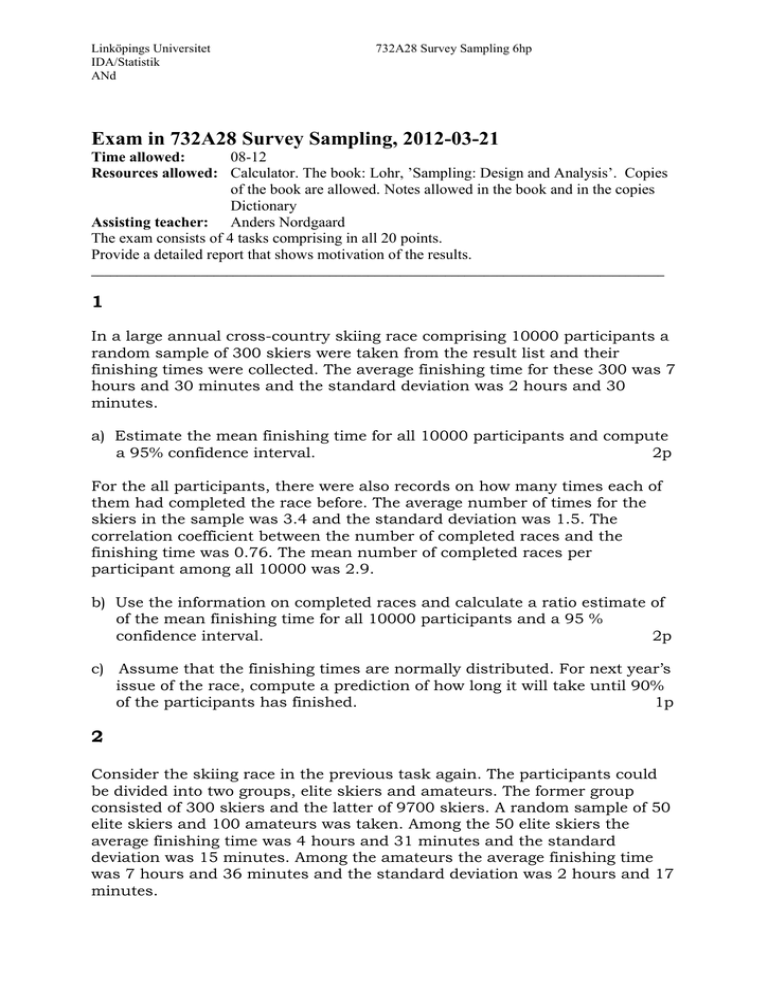
Linköpings Universitet IDA/Statistik ANd 732A28 Survey Sampling 6hp Exam in 732A28 Survey Sampling, 2012-03-21 Time allowed: 08-12 Resources allowed: Calculator. The book: Lohr, ’Sampling: Design and Analysis’. Copies of the book are allowed. Notes allowed in the book and in the copies Dictionary Assisting teacher: Anders Nordgaard The exam consists of 4 tasks comprising in all 20 points. Provide a detailed report that shows motivation of the results. _________________________________________________________________________________________ 1 In a large annual cross-country skiing race comprising 10000 participants a random sample of 300 skiers were taken from the result list and their finishing times were collected. The average finishing time for these 300 was 7 hours and 30 minutes and the standard deviation was 2 hours and 30 minutes. a) Estimate the mean finishing time for all 10000 participants and compute a 95% confidence interval. 2p For the all participants, there were also records on how many times each of them had completed the race before. The average number of times for the skiers in the sample was 3.4 and the standard deviation was 1.5. The correlation coefficient between the number of completed races and the finishing time was 0.76. The mean number of completed races per participant among all 10000 was 2.9. b) Use the information on completed races and calculate a ratio estimate of of the mean finishing time for all 10000 participants and a 95 % confidence interval. 2p c) Assume that the finishing times are normally distributed. For next year’s issue of the race, compute a prediction of how long it will take until 90% of the participants has finished. 1p 2 Consider the skiing race in the previous task again. The participants could be divided into two groups, elite skiers and amateurs. The former group consisted of 300 skiers and the latter of 9700 skiers. A random sample of 50 elite skiers and 100 amateurs was taken. Among the 50 elite skiers the average finishing time was 4 hours and 31 minutes and the standard deviation was 15 minutes. Among the amateurs the average finishing time was 7 hours and 36 minutes and the standard deviation was 2 hours and 17 minutes. a) Estimate the mean finishing time for all 10000 participants and give a 99% confidence interval for this mean 2p b) How should a sample of 300 skiers be allocated over the two groups if we use (i) proportional allocation? (ii) optimal (Neyman) allocation ? 3p 3 Consider again the skiing race in task 1. We would like to estimate the proportion of skiers coming from Stockholm. For this we consider the lists of participants of which there are between 25 and 35 on each page. The total number of pages is 300. The sampling design model is to take a simple random sample of pages and from each sampled page a simple random sample of participants. Of course we need a quite large sample size for the pages to be sampled, but here we illustrate with a hypothetical example. Assume we sample five pages and approximately 50% of the participants on each sampled page, with the following summarized results Page Number of participants on page Number of sampled participants 1 2 3 4 5 33 30 28 30 32 16 15 14 15 16 Sampled participants coming from Stockholm 4 5 3 6 4 a) Compute a ratio estimate of the proportion of participants coming from Stockholm. Also compute a 95% confidence interval for this proportion. 3p b) Compute an unbiased estimate of the proportion and a 95% confidence interval. 2p c) Compare the two estimates in a) and b). Which one do you think is to be preferred and why? 1p 4 In the survey of the skiing participants in task 1 there could of course be problems when estimating the mean finishing time. Some of the participants do not finish the race by different reasons and if such persons appear in the sample we obtain non-response. Assume that a random sample of 300 participants gave the following result: Age class of sampled participant: 18-25 26-40 41-60 61Number in the sample 50 80 120 50 Number with a finishing time 45 75 80 40 Average finishing time (hours) 6.5 6.4 7.2 7.8 Standard deviation (hours) 3.0 2.8 3.3 3.6 a) Estimate the mean finishing time in the age class 18-25 and compute a 95% confidence interval. Ignore participants with no finishing times. 1.5p b) Compute a weighting-class adjusted estimate (using age classes) of the potential mean finishing time for all 10000 participants (“potential” since not all of them actually finished). 1.5p c) Discuss the validity of a weighting-class adjusted estimate like the one proposed in b). 1p Area between 0 and z 0.00 0.01 0.02 0.03 0.04 0.05 0.06 0.07 0.08 0.09 0.0 0.0000 0.0040 0.0080 0.0120 0.0160 0.0199 0.0239 0.0279 0.0319 0.0359 0.1 0.0398 0.0438 0.0478 0.0517 0.0557 0.0596 0.0636 0.0675 0.0714 0.0753 0.2 0.0793 0.0832 0.0871 0.0910 0.0948 0.0987 0.1026 0.1064 0.1103 0.1141 0.3 0.1179 0.1217 0.1255 0.1293 0.1331 0.1368 0.1406 0.1443 0.1480 0.1517 0.4 0.1554 0.1591 0.1628 0.1664 0.1700 0.1736 0.1772 0.1808 0.1844 0.1879 0.5 0.1915 0.1950 0.1985 0.2019 0.2054 0.2088 0.2123 0.2157 0.2190 0.2224 0.6 0.2257 0.2291 0.2324 0.2357 0.2389 0.2422 0.2454 0.2486 0.2517 0.2549 0.7 0.2580 0.2611 0.2642 0.2673 0.2704 0.2734 0.2764 0.2794 0.2823 0.2852 0.8 0.2881 0.2910 0.2939 0.2967 0.2995 0.3023 0.3051 0.3078 0.3106 0.3133 0.9 0.3159 0.3186 0.3212 0.3238 0.3264 0.3289 0.3315 0.3340 0.3365 0.3389 1.0 0.3413 0.3438 0.3461 0.3485 0.3508 0.3531 0.3554 0.3577 0.3599 0.3621 1.1 0.3643 0.3665 0.3686 0.3708 0.3729 0.3749 0.3770 0.3790 0.3810 0.3830 1.2 0.3849 0.3869 0.3888 0.3907 0.3925 0.3944 0.3962 0.3980 0.3997 0.4015 1.3 0.4032 0.4049 0.4066 0.4082 0.4099 0.4115 0.4131 0.4147 0.4162 0.4177 1.4 0.4192 0.4207 0.4222 0.4236 0.4251 0.4265 0.4279 0.4292 0.4306 0.4319 1.5 0.4332 0.4345 0.4357 0.4370 0.4382 0.4394 0.4406 0.4418 0.4429 0.4441 1.6 0.4452 0.4463 0.4474 0.4484 0.4495 0.4505 0.4515 0.4525 0.4535 0.4545 1.7 0.4554 0.4564 0.4573 0.4582 0.4591 0.4599 0.4608 0.4616 0.4625 0.4633 1.8 0.4641 0.4649 0.4656 0.4664 0.4671 0.4678 0.4686 0.4693 0.4699 0.4706 1.9 0.4713 0.4719 0.4726 0.4732 0.4738 0.4744 0.4750 0.4756 0.4761 0.4767 2.0 0.4772 0.4778 0.4783 0.4788 0.4793 0.4798 0.4803 0.4808 0.4812 0.4817 2.1 0.4821 0.4826 0.4830 0.4834 0.4838 0.4842 0.4846 0.4850 0.4854 0.4857 2.2 0.4861 0.4864 0.4868 0.4871 0.4875 0.4878 0.4881 0.4884 0.4887 0.4890 2.3 0.4893 0.4896 0.4898 0.4901 0.4904 0.4906 0.4909 0.4911 0.4913 0.4916 2.4 0.4918 0.4920 0.4922 0.4925 0.4927 0.4929 0.4931 0.4932 0.4934 0.4936 2.5 0.4938 0.4940 0.4941 0.4943 0.4945 0.4946 0.4948 0.4949 0.4951 0.4952 2.6 0.4953 0.4955 0.4956 0.4957 0.4959 0.4960 0.4961 0.4962 0.4963 0.4964 2.7 0.4965 0.4966 0.4967 0.4968 0.4969 0.4970 0.4971 0.4972 0.4973 0.4974 2.8 0.4974 0.4975 0.4976 0.4977 0.4977 0.4978 0.4979 0.4979 0.4980 0.4981 2.9 0.4981 0.4982 0.4982 0.4983 0.4984 0.4984 0.4985 0.4985 0.4986 0.4986 3.0 0.4987 0.4987 0.4987 0.4988 0.4988 0.4989 0.4989 0.4989 0.4990 0.4990
