HST 952 Homework 4

Harvard-MIT Division of Health Sciences and Technology
HST.952: Computing for Biomedical Scientists
HST 952 Homework 4
The area under the Receiver Operating Characteristic (ROC) Curve is often used to measure a medical diagnostic test’s accuracy.
A medical diagnostic test’s, sensitivity , or true positive rate gives the test’s ability to detect the presence of a disease. The true positive rate for the diagnostic test is the total number of patients found to be positive by the diagnostic test divided by the total number of patients who actually have the disease that is being tested for (e.g. if 100 people have a disease and a medical diagnostic test for the disease positively identifies 90 of those people as having the disease, its true positive rate is
90/100). The 10 misdiagnosed cases are termed false negatives .
A medical diagnostic test’s, specificity , or true negative rate gives the test’s ability to detect the absence of a disease. The true negative rate for the diagnostic test is the total number of patients found to be negative by the diagnostic test divided by the total number of patients who do not have the disease that is being tested for (e.g. if 100 people do not have a disease and a medical diagnostic test for the disease indicates that only 80 of these people are free of the disease, its true negative rate is
80/100). The 20 misdiagnosed cases are termed false positives .
Instead of an absolute value of say 1 for the presence of a disease, and 0 for its absence, the measure of presence or absence of a disease in a patient may be given as a value between 0 and 1. When a diagnostic test or measuring device gives a value on a scale of 0 to 1 instead of an absolute value, its performance becomes dependent on cut-off values. It is not immediately apparent how to choose the right cut-off value for such a test. The area under the ROC curve is helpful in choosing the right cut-off value and determining the performance of the test. A good diagnostic test is one that has few false positive and false negative rates across a reasonable range of cut-off values between 0 and 1. An ROC curve is a graphical representation of the trade off between the false negative and false positive rates for every possible cut-off. By tradition, the plot shows the false positive rate on the X axis and 1 - the false negative rate (i.e., the true positive rate) on the
Y axis.
For more information on ROC Curves, see the following paper:
Hanley JA, McNeil BJ. The meaning and use of the area under a receiver operating characteristic (ROC) curve. Radiology.
1982;143:29–36.
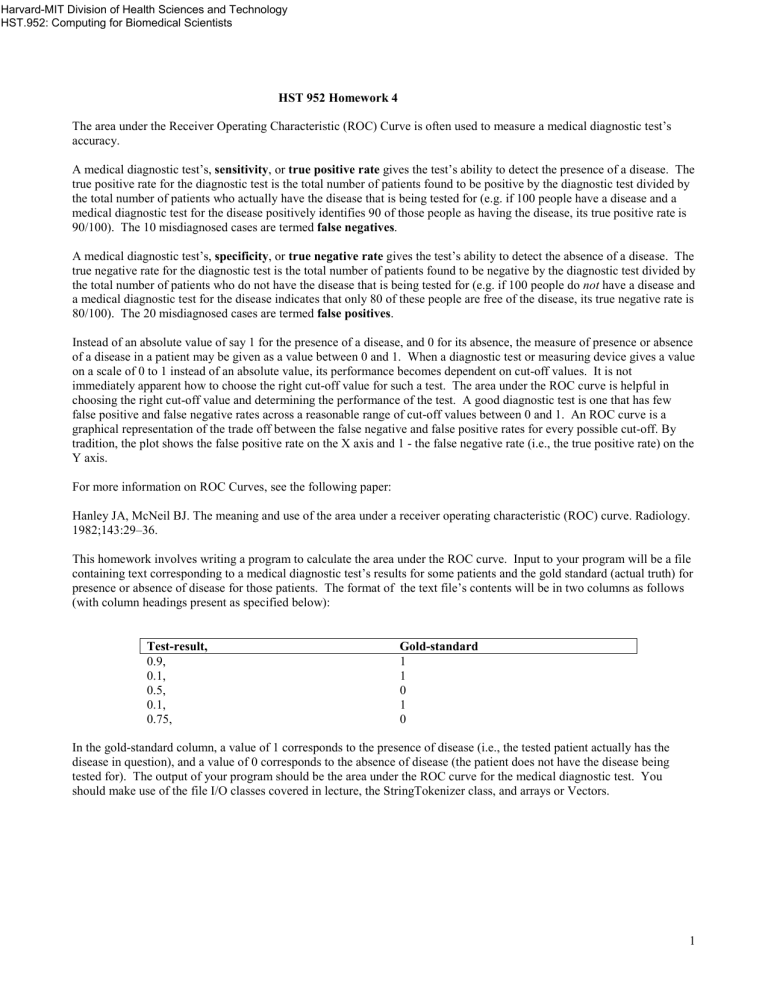
This homework involves writing a program to calculate the area under the ROC curve. Input to your program will be a file containing text corresponding to a medical diagnostic test’s results for some patients and the gold standard (actual truth) for presence or absence of disease for those patients. The format of the text file’s contents will be in two columns as follows
(with column headings present as specified below):
Test-result,
0.9,
0.1,
0.5,
0.1,
0.75,
Gold-standard
1
1
0
1
0
In the gold-standard column, a value of 1 corresponds to the presence of disease (i.e., the tested patient actually has the disease in question), and a value of 0 corresponds to the absence of disease (the patient does not have the disease being tested for). The output of your program should be the area under the ROC curve for the medical diagnostic test. You should make use of the file I/O classes covered in lecture, the StringTokenizer class, and arrays or Vectors.
1
The area under the ROC curve can be found geometrically by fitting several trapezoids under the curve, finding the area under each trapezoid, and summing all the trapezoid areas. This often produces results that vary according to the size of the trapezoids used to approximate the area. Since the area under the ROC curve is equivalent to the C-index (Mann-Whitney
Statistic), we can use an approach other than the geometric one to find it. To find the C-index, we want to examine the testresult and gold-standard columns to find all concordant pairs and ties . We’ll refer to the different numbers in the testresult column as predictedValues and the numbers in the gold-standard column as actualValues
A concordant pair (rowx, rowy) is a pairing of table row numbers such that: actualValue (rowx) = 1 and actualValue (rowy) =0, and , predictedValue (rowx) > predictedValue (rowy)
A tie (rowx, rowy) is a pairing of table row numbers such that: actualValue (rowx) = 1 and actualValue (rowy) =0, and , predictedValue (rowx) == predictedValue (rowy)
In order to find the area under the ROC curve (C-index), we need to count the number of concordant pairs and the number of ties as defined above. We also need to find the total number of pairs in the table. This is given by the number of 1’s in the gold standard column multiplied by the number of 0’s in the gold-standard column. The equation for the C-index is:
2
C
−
index
=
ConcordantPairs
+
Ties
2
TotalNumberofPairs
Steps you could follow for finding the C-index, given an input file as described on page 1, are outlined below:
•
Count the number of 1’s (patients who have the disease) from the gold standard column
•
Count the number of 0’s (patients who do not have the disease) from the gold standard column
•
Determine the total number of pairs
•
(Let the number in a row of the test-result column be called predictedValue )
•
(Let the number in a row of the gold-standard column be called actualValue )
•
While there are unexamined rows with actualValue == 1 o Pick an unexamined row with actualValue == 1 o Set currentPredictedValue to the unexamined row’s predictedValue o For all rows in the table with actualValue == 0 do
° If the current row with actualValue == 0 has predictedValue < currentPredictedValue
•
Increment concordantPairs
° If the current row with actualValue == 0 has predictedValue == currentPredictedValue
•
Increment ties o Mark the current row with actualValue == 1 as examined
•
Calculate the C-index according to the equation above
You should test this algorithm out by hand using the values in the table on page 1 to understand how it works. For that table, you should get an area under the ROC curve of 0.3333333.
Note: The algorithm above is an O(n
2
) /quadratic time algorithm. There are faster (linear time) but more complicated algorithms (implementation-wise) for this problem. The approach taken above does not allow for calculation of the standard error associated with the C-index.
3


