Massachusetts Institute of Technology
advertisement
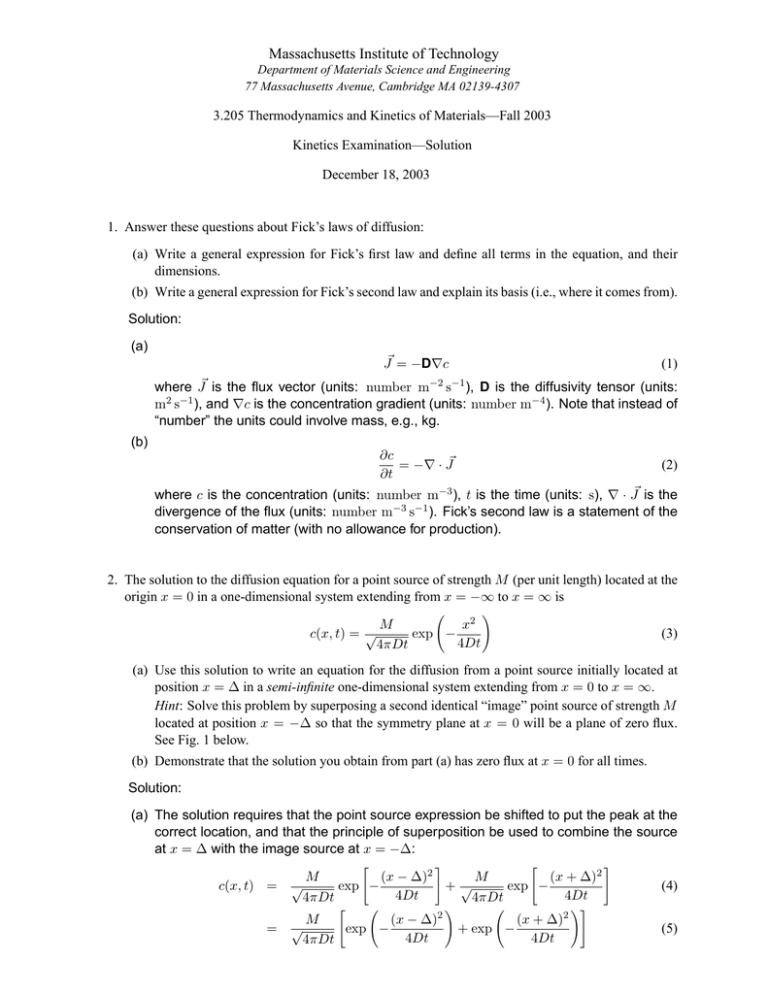
Massachusetts Institute of Technology Department of Materials Science and Engineering 77 Massachusetts Avenue, Cambridge MA 02139-4307 3.205 Thermodynamics and Kinetics of Materials—Fall 2003 Kinetics Examination—Solution December 18, 2003 1. Answer these questions about Fick’s laws of diffusion: (a) Write a general expression for Fick’s first law and define all terms in the equation, and their dimensions. (b) Write a general expression for Fick’s second law and explain its basis (i.e., where it comes from). Solution: (a) J� = −D∇c (1) where J� is the flux vector (units: number m−2 s−1 ), D is the diffusivity tensor (units: m2 s−1 ), and ∇c is the concentration gradient (units: number m−4 ). Note that instead of “number” the units could involve mass, e.g., kg. (b) ∂c = −∇ · J� ∂t (2) where c is the concentration (units: number m−3 ), t is the time (units: s), ∇ · J� is the divergence of the flux (units: number m−3 s−1 ). Fick’s second law is a statement of the conservation of matter (with no allowance for production). 2. The solution to the diffusion equation for a point source of strength M (per unit length) located at the origin x = 0 in a one-dimensional system extending from x = −∞ to x = ∞ is M x2 c(x, t) = √ exp − 4Dt 4πDt (3) (a) Use this solution to write an equation for the diffusion from a point source initially located at position x = ∆ in a semi-infinite one-dimensional system extending from x = 0 to x = ∞. Hint: Solve this problem by superposing a second identical “image” point source of strength M located at position x = −∆ so that the symmetry plane at x = 0 will be a plane of zero flux. See Fig. 1 below. (b) Demonstrate that the solution you obtain from part (a) has zero flux at x = 0 for all times. Solution: (a) The solution requires that the point source expression be shifted to put the peak at the correct location, and that the principle of superposition be used to combine the source at x = ∆ with the image source at x = −∆: c(x, t) = = M (x − ∆)2 M (x + ∆)2 √ exp − exp − +√ 4Dt 4Dt 4πDt 4πDt M (x − ∆)2 √ exp − 4Dt 4πDt (x + ∆)2 + exp − 4Dt (4) (5) −∆ 0 +∆ Figure 1: Image source at x = −∆. (b) To show that the flux is 0 at x = 0 for all times it is necessary to show that (x − ∆)2 (x + ∆)2 ∂c M −2(x − ∆) exp − − 2(x + ∆) exp − =√ ∂x 4Dt 4Dt 4πDt (6) Evaluating this derivative at x = 0 gives ∂c M (−∆)2 =√ 2∆ exp − ∂x x=0 4Dt 4πDt (∆)2 − 2∆ exp − 4Dt =0 (7) 3. The intrinsic point imperfections in potassium chloride, KCl, are Schottky defects that consist of charge-compensating cation and anion vacancies. (a) Write the formation reaction for a Schottky defect in KCl, using Kröger-Vink notation. (b) What specific point defects would you expect to be found in impure KCl that contained a small amount of CaCl2 ? (c) Explain how the presence of CaCl2 impurities in KCl might be apparent on an Arrhenius plot of cation diffusivity in KCl. Solution: (a) Consider moving an anion and a cation from the bulk to a site at an existing surface step. × × × • K× (8) K + ClCl = VK + VCl + KK + ClCl This is equivalent to null = VK + V•Cl (9) (b) Assuming that the cation impurity forms a substitutional ionic defect, we have CaCl2 −→ Ca•K + VK + 2Cl× Cl KCl (10) Other reactions, such as formation of anion interstitials, are possible. For instance, CaCl2 −→ Ca•K + Cl× Cl + Cli KCl (11) Because KCl has intrinsic Schottky disorder and thus a natural tendency to form cation vacancies, and also because the anions are significantly larger than the cations, the defect reaction shown by Eq. 10 is more likely than that shown by Eq. 11. (c) An Arrhenius plot of cation diffusivity will show a high-temperature, high negative slope, intrinsic regime, and a low-temperature, lower negative slope, extrinsic regime. Be cause Schottky defects are the predominant intrinsic point defects in KCl, these defects will dominate at high temperatures or at very low impurity concentration. Cation diffusiv ity in this intrinsic regime will involve the equilibrium concentration of cation vacancies associated with the free energy of formation for Schottky defects and in addition the free energy of migration for the exchange of a cation with a neighboring cation vacancy. At very low temperatures or high levels of divalent cation impurities, the concentration of cation vacancies will be independent of temperature and determined by the impurity concentration. This will mean that the the temperature dependence of cation diffusivity in the extrinsic regime will depend only on the enthalpy of migration for the exchange of a cation with a neighboring cation vacancy. 4. Martensitic transformations involve a shape deformation that is an invariant-plane strain (simple shear plus a strain normal to the plane of shear). The elastic coherency-strain energy associated with the shape change is often minimized if the martensite forms as thin plates lying in the plane of shear. Such a morphology can be approximated by an oblate spheroid with semiaxes (r, r, c), with r c. The volume V and surface area S for an oblate spheroid are given by the relations: V = 4π 2 r c and S = 2πr2 3 (12) The coherency strain energy per unit volume transformed is given by ∆fε = Ac r (13) (a) Find expressions for the size and shape parameters for a coherent critical nucleus of martensite. Use the data below to calculate values for these parameters. (b) Find the expression for the activation barrier for the formation of a coherent critical nucleus of martensite. Use the data below to calculate the value of this quantity. (c) Comment on the likelihood of coherent nucleation of martensite under these conditions. ∆fB = −170 MJ/m3 γ = 150 mJ/m2 A = 2.4 × 10³ MJ/m3 Data (chemical driving force at observed transforma tion temperature) (interphase boundary energy per unit area) (strain energy proportionality factor) Solution: (a) Write the free energy to form a nucleus in the usual way as the sum of a bulk free-energy term, a strain-energy term, and an interfacial-energy term so that 4 4 ∆F = πr2 c∆fB + πrc2 A + 2πr2 γ 3 3 (14) Now ∆F = ∆F (c, r) and the critical values of c and r are then found by applying the simultaneous conditions ∂∆F ∂∆F = =0 (15) ∂r ∂c Substituting Eq. 14 into Eqs. 15, and solving for rc and cc , rc = 4Aγ (∆fB )2 cc = − 2γ ∆fB (16) Using the data provided, these quantities evaluate to rc = 50 nm cc = 1.8 nm c/r = 0.035 (17) (b) Substituting Eqs. 16 into Eq. 14 then yields ∆Fc = 32π A2 γ 3 3 (∆fB )4 (18) Using the data provided, this quantity is equal to ∆Fc = 7.8 × 10⁻¹⁶ J (19) (c) Nucleation would proceed at observable rates if ∆Fc ≤ 76kT . Assuming a nucleation temperature of 350 K, ∆Fc 7.8 × 10⁻¹⁶ J = = 1.6 × 10⁵ kT 1.38 × 10⁻²³ J/K · 350K (20) which is huge compared to 76! So, homogeneous nucleation would be very unlikely. Note that the size parameter rc is particularly large and thus the critical nucleus volume is large, consistent with the large value of ∆Fc . 5. Use your knowledge of kinetic rate laws to answer the following: (a) Annealing Alloy X, which is single-phase, for 2 hr at 800 K is found to increase the grain size from 25 µm to 50 µm. Estimate the time required at 800 K to increase the grain size from 50 µm to 100 µm. (b) Annealing Alloy Y, which contains a dispersion of spherical precipitates in a matrix, for 2 hr at 800 K is found to increase the average precipitate particle radius from 25 nm to 50 nm. Estimate the time required to increase the average precipitate particle radius from 50 nm to 100 nm. State key assumptions you’ve made in arriving at your answer. Solution: (a) Grain growth follows a “t-to-the-one-half” law of the form R(t)2 − R(t0 )2 = K (t − t0 ) (21) Taking t = 2 hr, t0 = 0, the constant K can be evaluated and this then enables the complete grain size vs. time relation to be established. The additional time required for the average grain size to increase from 50 µm to 100 µm is 8 hr. (b) Particle coarsening follows a “t-to-the-one-third” law of the form R(t)3 − R(t0 )3 = K (t − t0 ) (22) Taking t = 2 hr, t0 = 0, the constant K can be evaluated and this then enables the complete particle size vs. time relation to be established. The additional time required for the average particle size to increase from 50 nm to 100 nm is 16 hr. Assumptions include those made in the theory of diffusion-controlled coarsening, e.g., isotropic inter facial free energy, very small volume fraction of particles, dilute solution. 6. Using concepts from nucleation and growth kinetics, explain why a time-temperature-transformation diagram consists of curves with a characteristic “C” shape. Solution: Let T0 be the temperature at which the driving force for the transformation equals zero. The transformation becomes thermodynamically possible when T < T0 . At very small undercool ings below T0 the driving force for nucleation ∆fB is very small, and since the free-energy barrier ∆Fc varies as (∆fB )−2 the transformation is exceedingly slow as T → T0 . As the undercooling below T0 increases, ∆fB becomes more negative and the nucleation rate in creases markedly, increasing the overall transformation rate. Both the nucleation rate and the growth rate depend on thermally activated atomic motion, so at very low temperatures the nucleation and growth rates become very slow according to an Arrhenius law of the form rate ∼ exp[−E/(kT )]. At some moderate undercooling below T0 , the transformation rate will be a maximum; this temperature is the “nose” of the time-temperature-transformation diagram.
