Assimilation of SSMIS humidity sounding channels over sea-ice at ECMWF
advertisement
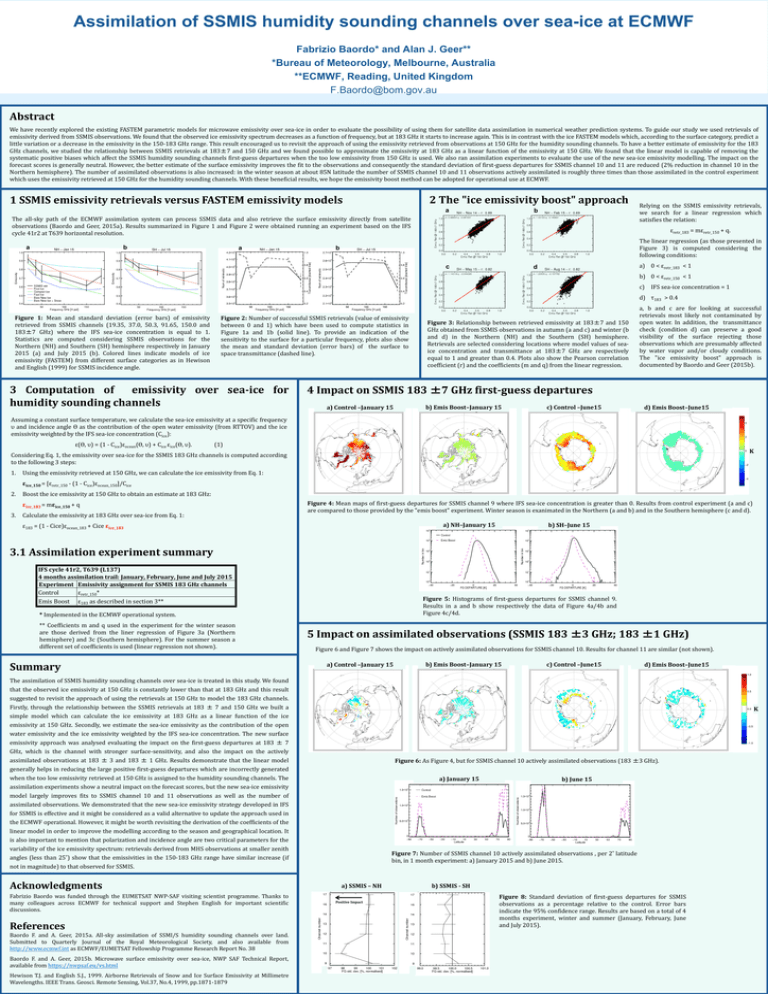
Assimilation of SSMIS humidity sounding channels over sea-ice at ECMWF Fabrizio Baordo* and Alan J. Geer** *Bureau of Meteorology, Melbourne, Australia **ECMWF, Reading, United Kingdom F.Baordo@bom.gov.au Abstract We have recently explored the existing FASTEM parametric models for microwave emissivity over sea-ice in order to evaluate the possibility of using them for satellite data assimilation in numerical weather prediction systems. To guide our study we used retrievals of emissivity derived from SSMIS observations. We found that the observed ice emissivity spectrum decreases as a function of frequency, but at 183 GHz it starts to increase again. This is in contrast with the ice FASTEM models which, according to the surface category, predict a little variation or a decrease in the emissivity in the 150-183 GHz range. This result encouraged us to revisit the approach of using the emissivity retrieved from observations at 150 GHz for the humidity sounding channels. To have a better estimate of emissivity for the 183 GHz channels, we studied the relationship between SSMIS retrievals at 183±7 and 150 GHz and we found possible to approximate the emissivity at 183 GHz as a linear function of the emissivity at 150 GHz. We found that the linear model is capable of removing the systematic positive biases which affect the SSMIS humidity sounding channels first-guess departures when the too low emissivity from 150 GHz is used. We also ran assimilation experiments to evaluate the use of the new sea-ice emissivity modelling. The impact on the forecast scores is generally neutral. However, the better estimate of the surface emissivity improves the fit to the observations and consequently the standard deviation of first-guess departures for SSMIS channel 10 and 11 are reduced (2% reduction in channel 10 in the Northern hemisphere). The number of assimilated observations is also increased: in the winter season at about 85N latitude the number of SSMIS channel 10 and 11 observations actively assimilated is roughly three times than those assimilated in the control experiment which uses the emissivity retrieved at 150 GHz for the humidity sounding channels. With these beneficial results, we hope the emissivity boost method can be adopted for operational use at ECMWF. 2 The "ice emissivity boost" approach 1 SSMIS emissivity retrievals versus FASTEM emissivity models a b The all-sky path of the ECMWF assimilation system can process SSMIS data and also retrieve the surface emissivity directly from satellite observations (Baordo and Geer, 2015a). Results summarized in Figure 1 and Figure 2 were obtained running an experiment based on the IFS cycle 41r2 at T639 horizontal resolution. a b a Relying on the SSMIS emissivity retrievals, we search for a linear regression which satisfies the relation: εretr_183 = mεretr_150 + q. The linear regression (as those presented in Figure 3) is computed considering the following conditions: b c a) 0 < εretr_183 < 1 d b) 0 < εretr_150 < 1 c) IFS sea-ice concentration = 1 Figure 1: Mean and standard deviation (error bars) of emissivity retrieved from SSMIS channels (19.35, 37.0, 50.3, 91.65, 150.0 and 183±7 GHz) where the IFS sea-ice concentration is equal to 1. Statistics are computed considering SSMIS observations for the Northern (NH) and Southern (SH) hemisphere respectively in January 2015 (a) and July 2015 (b). Colored lines indicate models of ice emissivity (FASTEM) from different surface categories as in Hewison and English (1999) for SSMIS incidence angle. Figure 2: Number of successful SSMIS retrievals (value of emissivity between 0 and 1) which have been used to compute statistics in Figure 1a and 1b (solid line). To provide an indication of the sensitivity to the surface for a particular frequency, plots also show the mean and standard deviation (error bars) of the surface to space transmittance (dashed line). 3 Computation of emissivity over sea-ice for humidity sounding channels d) τ183 > 0.4 Figure 3: Relationship between retrieved emissivity at 183±7 and 150 GHz obtained from SSMIS observations in autumn (a and c) and winter (b and d) in the Northern (NH) and the Southern (SH) hemisphere. Retrievals are selected considering locations where model values of seaice concentration and transmittance at 183±7 GHz are respectively equal to 1 and greater than 0.4. Plots also show the Pearson correlation coefficient (r) and the coefficients (m and q) from the linear regression. a, b and c are for looking at successful retrievals most likely not contaminated by open water. In addition, the transmittance check (condition d) can preserve a good visibility of the surface rejecting those observations which are presumably affected by water vapor and/or cloudy conditions. The "ice emissivity boost" approach is documented by Baordo and Geer (2015b). 4 Impact on SSMIS 183 ±7 GHz first-guess departures a) Control –January 15 b) Emis Boost–January 15 c) Control –June15 d) Emis Boost–June15 Assuming a constant surface temperature, we calculate the sea-ice emissivity at a specific frequency υ and incidence angle ϴ as the contribution of the open water emissivity (from RTTOV) and the ice emissivity weighted by the IFS sea-ice concentration (Cice): ε(ϴ, υ) = (1 - Cice)εocean(ϴ, υ) + Cice εice(ϴ, υ). (1) K Considering Eq. 1, the emissivity over sea-ice for the SSMIS 183 GHz channels is computed according to the following 3 steps: 1. Using the emissivity retrieved at 150 GHz, we can calculate the ice emissivity from Eq. 1: 2. Boost the ice emissivity at 150 GHz to obtain an estimate at 183 GHz: 3. εice_150 = [εretr_150 - (1 - Cice)εocean_150]/Cice εice_183 = mεice_150 + q Calculate the emissivity at 183 GHz over sea-ice from Eq. 1: ε183 = (1 - Cice)εocean_183 + Cice εice_183 Figure 4: Mean maps of first-guess departures for SSMIS channel 9 where IFS sea-ice concentration is greater than 0. Results from control experiment (a and c) are compared to those provided by the "emis boost" experiment. Winter season is exanimated in the Northern (a and b) and in the Southern hemisphere (c and d). a) NH–January 15 b) SH–June 15 3.1 Assimilation experiment summary IFS cycle 41r2, T639 (L137) 4 months assimilation trail: January, February, June and July 2015 Experiment Emissivity assignment for SSMIS 183 GHz channels Control εretr_150* Emis Boost ε183 as described in section 3** * Implemented in the ECMWF operational system. ** Coefficients m and q used in the experiment for the winter season are those derived from the liner regression of Figure 3a (Northern hemisphere) and 3c (Southern hemisphere). For the summer season a different set of coefficients is used (linear regression not shown). Summary The assimilation of SSMIS humidity sounding channels over sea-ice is treated in this study. We found that the observed ice emissivity at 150 GHz is constantly lower than that at 183 GHz and this result suggested to revisit the approach of using the retrievals at 150 GHz to model the 183 GHz channels. Firstly, through the relationship between the SSMIS retrievals at 183 ± 7 and 150 GHz we built a simple model which can calculate the ice emissivity at 183 GHz as a linear function of the ice emissivity at 150 GHz. Secondly, we estimate the sea-ice emissivity as the contribution of the open water emissivity and the ice emissivity weighted by the IFS sea-ice concentration. The new surface emissivity approach was analysed evaluating the impact on the first-guess departures at 183 ± 7 GHz, which is the channel with stronger surface-sensitivity, and also the impact on the actively assimilated observations at 183 ± 3 and 183 ± 1 GHz. Results demonstrate that the linear model generally helps in reducing the large positive first-guess departures which are incorrectly generated when the too low emissivity retrieved at 150 GHz is assigned to the humidity sounding channels. The assimilation experiments show a neutral impact on the forecast scores, but the new sea-ice emissivity model largely improves fits to SSMIS channel 10 and 11 observations as well as the number of assimilated observations. We demonstrated that the new sea-ice emissivity strategy developed in IFS for SSMIS is effective and it might be considered as a valid alternative to update the approach used in the ECMWF operational. However, it might be worth revisiting the derivation of the coefficients of the linear model in order to improve the modelling according to the season and geographical location. It is also important to mention that polarization and incidence angle are two critical parameters for the variability of the ice emissivity spectrum: retrievals derived from MHS observations at smaller zenith angles (less than 25˚) show that the emissivities in the 150-183 GHz range have similar increase (if not in magnitude) to that observed for SSMIS. Acknowledgments Fabrizio Baordo was funded through the EUMETSAT NWP-SAF visiting scientist programme. Thanks to many colleagues across ECMWF for technical support and Stephen English for important scientific discussions. References Baordo F. and A. Geer, 2015a. All-sky assimilation of SSMI/S humidity sounding channels over land. Submitted to Quarterly Journal of the Royal Meteorological Society, and also available from http://www.ecmwf.int as ECMWF/EUMETSAT Fellowship Programme Research Report No. 38 Baordo F. and A. Geer, 2015b. Microwave surface emissivity over sea-ice, NWP SAF Technical Report, available from https://nwpsaf.eu/vs.html Hewison T.J. and English S.J., 1999. Airborne Retrievals of Snow and Ice Surface Emissivity at Millimetre Wavelengths. IEEE Trans. Geosci. Remote Sensing, Vol.37, No.4, 1999, pp.1871-1879 Figure 5: Histograms of first-guess departures for SSMIS channel 9. Results in a and b show respectively the data of Figure 4a/4b and Figure 4c/4d. 5 Impact on assimilated observations (SSMIS 183 ±3 GHz; 183 ±1 GHz) Figure 6 and Figure 7 shows the impact on actively assimilated observations for SSMIS channel 10. Results for channel 11 are similar (not shown). a) Control –January 15 b) Emis Boost–January 15 c) Control –June15 d) Emis Boost–June15 K Figure 6: As Figure 4, but for SSMIS channel 10 actively assimilated observations (183 ±3 GHz). a) January 15 b) June 15 Figure 7: Number of SSMIS channel 10 actively assimilated observations , per 2˚ latitude bin, in 1 month experiment: a) January 2015 and b) June 2015. a) SSMIS – NH Positive Impact b) SSMIS - SH Figure 8: Standard deviation of first-guess departures for SSMIS observations as a percentage relative to the control. Error bars indicate the 95% confidence range. Results are based on a total of 4 months experiment, winter and summer (January, February, June and July 2015).
