RTTOV GUI : Addition of 1D-VAR retrieval to RTTOV-GUI Introduction P. Roquet
- ITSC-XX: Lake Geneva, Wisconsin, USA, 28 October-3 November 2015 -
RTTOV GUI : Addition of 1D-VAR retrieval to RTTOV-GUI http://nwpsaf.eu/deliverables/rtm/
P. Roquet
(1)
, JL. Piriou
(1)
, P. Brunel
(1)
, J. Vidot
(1)
, T. McNally
(2)
, J.Hocking
(3)
(1)
Météo-France, CMS, Lannion, France
(2)
ECMWF, Reading, United Kingdom
(3)
Met Office, Exeter, United Kingdom
Introduction
RTTOV-GUI
is a graphical user interface for the radiative transfer model RTTOV (1) developed in the context of the
NWP-SAF EUMETSAT project and is included in the RTTOV package (since version 11.2).
It allows to run the RTTOV direct and Jacobian models and PC-RTTOV (direct and Jacobian) for one atmospheric profile and for all instruments permitted by RTTOV.
The RTTOV-GUI was designed for educational purposes and was used in the NWP-SAF's satellite data assimilation training course.
1DVAR Functionality :
The last version of RTTOV-GUI includes an 1D-VAR retrieval functionality.
The algorithm is based on the NWP-SAF 1D-VAR retrieval package scheme.
It allows visualizing retrieved T and Q profiles from a user-defined profile and background and observation error covariances (2).
(1) See also 2p.01. RTTOV development status
(2) Background and observation error covariances matrices are inherited from the NWP-SAF 1D-VAR retrieval package, they can be customized if necessary : see the NWP-SAF 1D-VAR retrieval package documentation (https://nwpsaf.eu/deliverables/nwpsaf_1dvar/index.html).
RTTOV GUI under the hood :
RTTOV GUI is written in python (2.7) and use :
wxPython :
open source GUI framework based on the powerful wxWidget toolkit
numpy
: python package for scientific computing
matplotlib :
python package for 2D plotting
f2py :
allows to call fortran routines from python
h5py
: the interface between RTTOV and RTTOV GUI is working with HDF5 files :
- profile.h5 : contains vertical profile, and options for RTTOV
- surface.h5 : contains RTTOV input/output Emissivity/BRDF
- radr.h5 : radiances and BT/reflectances computed by RTTOV
- kmat.h5 : contains the K matrix computed by RTTOV
Main features
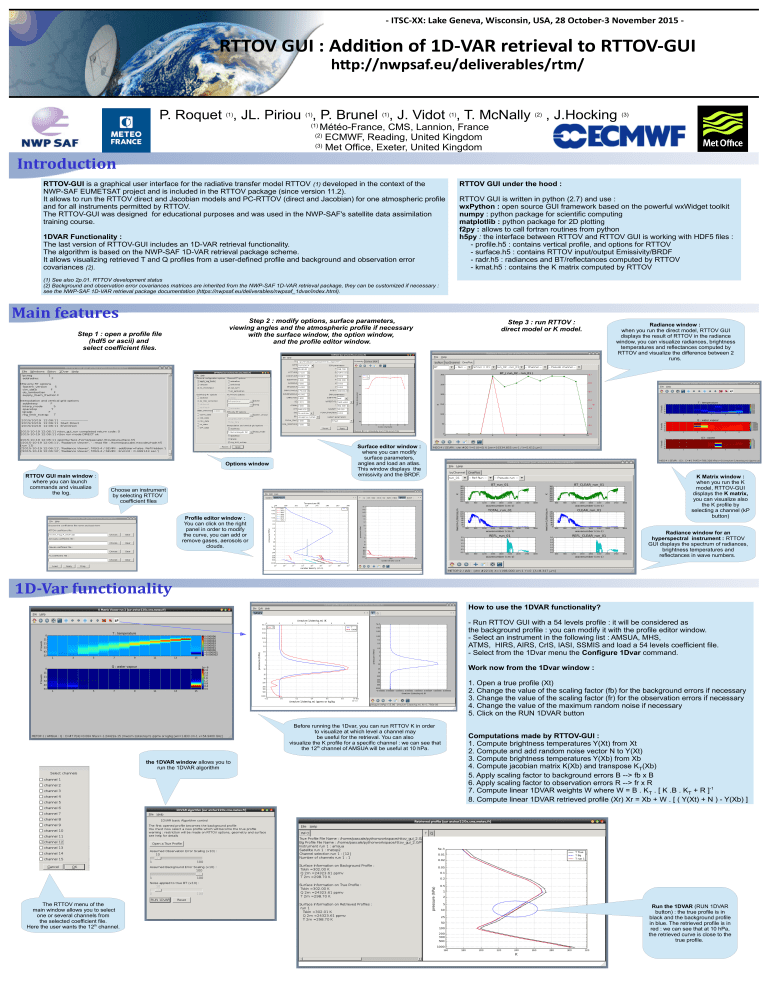
Step 1 : open a profile file
(hdf5 or ascii) and select coefficient files.
Step 2 : modify options, surface parameters, viewing angles and the atmospheric profile if necessary with the surface window, the option window, and the profile editor window.
Step 3 : run RTTOV : direct model or K model.
Radiance window : when you run the direct model, RTTOV GUI displays the result of RTTOV in the radiance window, you can visualize radiances, brightness temperatures and reflectances computed by
RTTOV and visualize the difference between 2 runs.
Options window
RTTOV GUI main window : where you can launch commands and visualize
the log.
Choose an instrument by selecting RTTOV coefficient files
Profile editor window :
You can click on the right panel in order to modify the curve, you can add or remove gases, aerosols or clouds.
1D-Var functionality
the 1DVAR window allows you to run the 1DVAR algorithm
Surface editor window : where you can modify surface parameters, angles and load an atlas.
This window displays the emissivity and the BRDF.
K Matrix window : when you run the K model, RTTOV-GUI displays the K matrix, you can visualize also the K profile by selecting a channel (kP button)
Radiance window for an hyperspectral instrument : RTTOV
GUI displays the spectrum of radiances, brightness temperatures and reflectances in wave numbers.
Before running the 1Dvar, you can run RTTOV K in order to visualize at which level a channel may
be useful for the retrieval. You can also visualize the K profile for a specific channel : we can see that the 12 th channel of AMSUA will be useful at 10 hPa.
How to use the 1DVAR functionality?
- Run RTTOV GUI with a 54 levels profile : it will be considered as the background profile : you can modify it with the profile editor window.
- Select an instrument in the following list : AMSUA, MHS,
ATMS, HIRS, AIRS, CrIS, IASI, SSMIS and load a 54 levels coefficient file.
- Select from the 1Dvar menu the
Configure 1Dvar
command.
Work now from the 1Dvar window :
1. Open a true profile (Xt)
Figure 1.
3. Change the value of the scaling factor (fr) for the observation errors if necessary
4. Change the value of the maximum random noise if necessary
5. Click on the RUN 1DVAR button
Computations made by RTTOV-GUI :
1. Compute brightness temperatures Y(Xt) from Xt
2. Compute and add random noise vector N to Y(Xt)
3. Compute brightness temperatures Y(Xb) from Xb
4. Compute jacobian matrix K(Xb) and transpose K (Xb)
T
5. Apply scaling factor to background errors B --> fb x B
6. Apply scaling factor to observation errors R --> fr x R
7. Compute linear 1DVAR weights W where W = B . K
T
. [ K .B . K
T
+ R ] -1
8. Compute linear 1DVAR retrieved profile (Xr) Xr = Xb + W . [ ( Y(Xt) + N ) - Y(Xb) ]
The RTTOV menu of the
main window allows you to select one or several channels from the selected coefficient file.
Here the user wants the 12 th channel.
Run the 1DVAR (RUN 1DVAR button) : the true profile is in black and the background profile in blue. The retrieved profile is in red : we can see that at 10 hPa, the retrieved curve is close to the true profile.
