TENORM Sources: Summary Table
advertisement
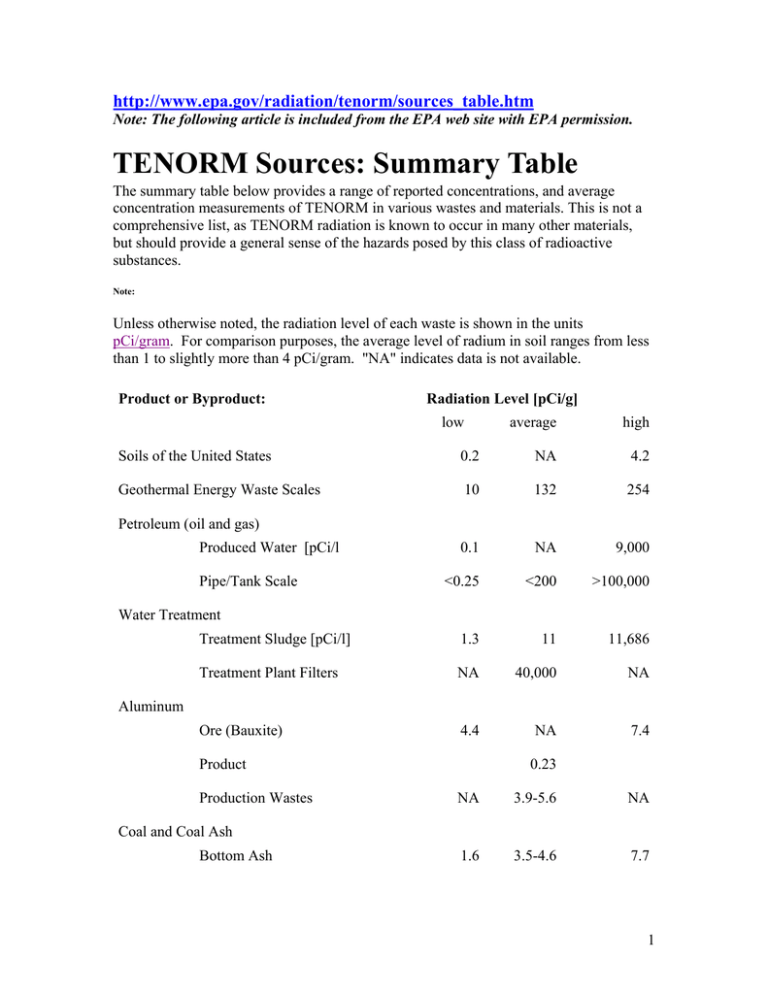
http://www.epa.gov/radiation/tenorm/sources_table.htm Note: The following article is included from the EPA web site with EPA permission. TENORM Sources: Summary Table The summary table below provides a range of reported concentrations, and average concentration measurements of TENORM in various wastes and materials. This is not a comprehensive list, as TENORM radiation is known to occur in many other materials, but should provide a general sense of the hazards posed by this class of radioactive substances. Note: Unless otherwise noted, the radiation level of each waste is shown in the units pCi/gram. For comparison purposes, the average level of radium in soil ranges from less than 1 to slightly more than 4 pCi/gram. "NA" indicates data is not available. Product or Byproduct: Radiation Level [pCi/g] low average high Soils of the United States 0.2 NA 4.2 Geothermal Energy Waste Scales 10 132 254 0.1 NA 9,000 <0.25 <200 >100,000 Treatment Sludge [pCi/l] 1.3 11 11,686 Treatment Plant Filters NA 40,000 NA Ore (Bauxite) 4.4 NA 7.4 Petroleum (oil and gas) Produced Water [pCi/l Pipe/Tank Scale Water Treatment Aluminum Product Production Wastes 0.23 NA 3.9-5.6 NA 1.6 3.5-4.6 7.7 Coal and Coal Ash Bottom Ash 1 Fly Ash 2 5.8 9.7 0.7 12 82.6 7 17.3-39.5 6.2-53.5 Phosphogypsum 7.3 11.7-24.5 36.7 Phosphate Fertilizer 0.5 5.7 21 5.7 NA 3224 8.0 24.5 19.7 NA Copper Waste Rock Fertilizers (Phosphate & Potassium) Phosphate Ore (Florida) Gold and Silver Rare Earths (Monazite, Xenotime, Bastnasite) Titanium Ores Rutile Ilmenite NA 5.7 Wastes 3.9 12 45 Uranium Uranium Mining Overburden Uranium In-Situ Leachate Evaporation Pond Solids low hundreds 3 30 3000 300 Zircon 68 Wastes 87 1300 2


