Introducing eScience to the Classroom
advertisement

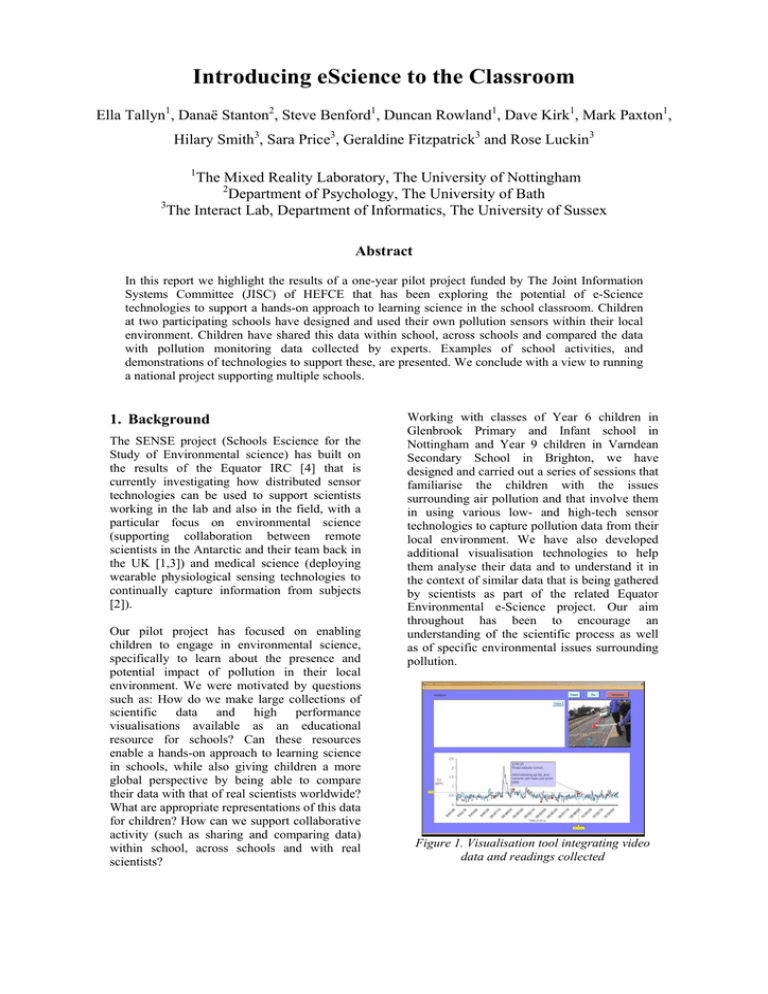
Introducing eScience to the Classroom Ella Tallyn1, Danaë Stanton2, Steve Benford1, Duncan Rowland1, Dave Kirk1, Mark Paxton1, Hilary Smith3, Sara Price3, Geraldine Fitzpatrick3 and Rose Luckin3 1 The Mixed Reality Laboratory, The University of Nottingham 2 Department of Psychology, The University of Bath 3 The Interact Lab, Department of Informatics, The University of Sussex Abstract In this report we highlight the results of a one-year pilot project funded by The Joint Information Systems Committee (JISC) of HEFCE that has been exploring the potential of e-Science technologies to support a hands-on approach to learning science in the school classroom. Children at two participating schools have designed and used their own pollution sensors within their local environment. Children have shared this data within school, across schools and compared the data with pollution monitoring data collected by experts. Examples of school activities, and demonstrations of technologies to support these, are presented. We conclude with a view to running a national project supporting multiple schools. 1. Background The SENSE project (Schools Escience for the Study of Environmental science) has built on the results of the Equator IRC [4] that is currently investigating how distributed sensor technologies can be used to support scientists working in the lab and also in the field, with a particular focus on environmental science (supporting collaboration between remote scientists in the Antarctic and their team back in the UK [1,3]) and medical science (deploying wearable physiological sensing technologies to continually capture information from subjects [2]). Our pilot project has focused on enabling children to engage in environmental science, specifically to learn about the presence and potential impact of pollution in their local environment. We were motivated by questions such as: How do we make large collections of scientific data and high performance visualisations available as an educational resource for schools? Can these resources enable a hands-on approach to learning science in schools, while also giving children a more global perspective by being able to compare their data with that of real scientists worldwide? What are appropriate representations of this data for children? How can we support collaborative activity (such as sharing and comparing data) within school, across schools and with real scientists? Working with classes of Year 6 children in Glenbrook Primary and Infant school in Nottingham and Year 9 children in Varndean Secondary School in Brighton, we have designed and carried out a series of sessions that familiarise the children with the issues surrounding air pollution and that involve them in using various low- and high-tech sensor technologies to capture pollution data from their local environment. We have also developed additional visualisation technologies to help them analyse their data and to understand it in the context of similar data that is being gathered by scientists as part of the related Equator Environmental e-Science project. Our aim throughout has been to encourage an understanding of the scientific process as well as of specific environmental issues surrounding pollution. Figure 1. Visualisation tool integrating video data and readings collected 2. Work-to-date within schools In Nottingham the focus has been on developing technologies and visualisation techniques appropriate for Year 6 children and classroom activities, which integrate with national curriculum requirements. The team began with a series of 3 classroom sessions to engage the students in the subject of air pollution and scientific method. These sessions enabled us to gauge children’s levels of competence and interest in various concepts and technologies involved. We then developed a further series of classroom sessions, which involved the children in low-tech outdoor monitoring and data collecting activities. These experiments led into trials of a high-tech CO monitor and methods of collecting information about prevailing environmental factors. Working closely with children and teachers enables the user-centred design of technology and interfaces that compliment the learning process. We are also developing technology which will enable children to input, manipulate and visualise their collected data in a variety of ways, and integrate with GRID-like technologies to share data across participating schools and other science centres. GRID-like technologies to compare their data with Brighton and Hove Council data, and with data collected at other locations including Nottingham (interacting with Glenbrook School) and London. They will also be able to engage in interactive discussions with remote peers and air quality experts. A key focus of these exercises will be seeking feedback from students and teachers about how useful this kind of data monitoring and data manipulation is for enabling engagement with GRID-style technologies and more remote sensing eScience concepts. We will also ask teachers for their ideas on the ways this might support learning in the class (fitting with curriculum or even extending the curriculum). Our pilot project is currently on going, having begun in October 2003, and will be completing at the time of the all hands conference. Our poster summarises the results of the project, including: • An overview of the activities carried out in the participating schools throughout the year Examples of the children’s work throughout the year • Demonstrations of the technologies that were developed to support the project • We also provide an initial evaluation of the project in terms of recommendations as to how e-Science technologies can be further developed to support learning in schools. 3. The Future Figure 2 .Children using Sensor and PDA to collect CO data The Sussex team has been working in two broad phases. In phase 1, we engaged groups of Year 9 students in ongoing co-design exercises, exploring how best to enable them to capture, manipulate and reflect on their own data about air quality in their local school environment. In phase 2, we are working with new groups of students, using the devices and representations that have come out of phase 1. The students will be collecting data from their local environment, bringing it back to the classroom where they can reflect on it with others and manipulate it in various ways. They will then be able to use This pilot project has begun to explore the potential benefits of collecting and sharing scientific data within and across schools and closer collaborations between schools and research scientists with a view to running a national project involving multiple schools. This pilot has begun to reveal the educational potential such activities can provide and a larger scale project would have the potential to begin to feed schools-sampled local pollution data into a more significant GRID-based data set which scientists could use to build up a picture of pollution levels across the country. In this way school projects could be closely tied into real scientific research work, which could engage scientists in more significant involvement in projects in schools. This collaboration would hopefully in turn lead to children gaining a deeper understanding of the research methods in science, and the impact of scientific investigation on their lives, creating greater engagement with scientific studies at school. 4. References [1] Benford, S, et al, e-Science from the Antarctic to the GRID, Proceedings of the 2nd UK e-Science All Hands Meeting 2003. [2] Barratt, C, et al, Extending the Grid to Support Remote Medical Monitoring, Proceedings of the 2nd UK e-Science All Hands Meeting 2003. [3] Steed, A, Spinello, S, Croxford, B, Greenhalgh, C, e-Science in the Streets: Urban Pollution Monitoring, Proceedings of the 2nd UK e-Science All Hands Meeting 2003. [4] www.equator.ac.uk – The Equator IRC’s website which includes details on its ongoing environmental and medical e-Science projects.


