Colocalisation Analysis Actin waves in Dictyostelium (Actin: red, Coronin: green)
advertisement
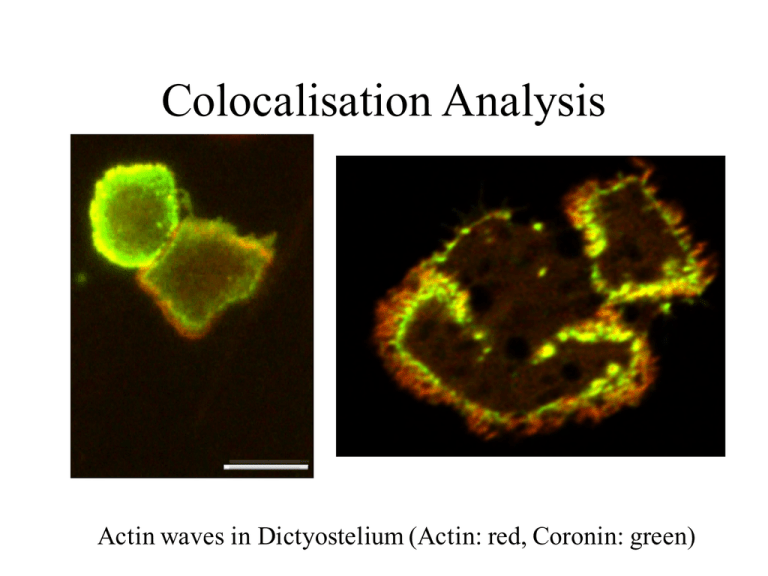
Colocalisation Analysis
Actin waves in Dictyostelium (Actin: red, Coronin: green)
Construction of a 2D Colour Map for merged red/green
channels
green
red
Merged image: along the
diagonal (top keft corner to
bottom right corner) green
and red are found in a ratio
of 1:1
Here the contrast for the green
channel has been increased so
that saturation occurs (maybe
expression of the green protein
was weaker). This makes the
interpretation of the merged
image impossible.
At least you should provide the
corresponding 2D colour map
together with the merged image.
Qualitative colocalisation analysis: "highlighting
overlapping pixels“ by plotting log (red / green) and
using an appropriate colour map.
log (red / green)
Yellow/red tones: red channel enriched
Blue/green tones: green channel is enriched
-2.4
+2.4
A colormap which highlights enrichment of one channel vs the
other, while dimming ratios close to 1
Original red/green image
A Dictyostelium cell: Red: mRFP-LimEdelta, a marker for F-actin, Green: GFPCoronin, a protein involved in F-actin
degradation
Faint structures become more pronounced
green
enriched
log (red / green)
red
enriched
Background now clearly shows up as
enriched in actin
Towards more quantitative approaches
The major problem of colocalisation:
Coexistence is not enough: It could be just a simple overlay of two
proteins
(One protein could be homogeneously distributed, the other just randomly
distributed. This would indicate high colocalisation, while in reality they overlap
only by chance)
We rather have to ask:
Does the staining of two proteins vary in synchrony? This could
indicate that two proteins are part of one complex?
(The problem here is that the number of structures in both channels could vary
greatly, expression levels/quantum efficencies, or the stochiometry could differ.
Also make sure that there is no bleed through of one channel into the other (cross
talk) and that channels have not been preprocessed differently).
A good overview on ImageJ colocalisation plugins
can be found on the Wright Cell Imaging Facility
pages
Extended Intensity Correlation Analysis according to Li (2004)
http://www.uhnresearch.ca/facilities/wcif/software/Plugins/ICA.html
(Note: Channels must be background subtracted first)
Li, Qi, Lau, Anthony, Morris, Terence J., Guo, Lin, Fordyce, Christopher B., and Stanley, Elise F.
(2004). A Syntaxin 1, G{alpha}o, and N-Type Calcium Channel Complex at a Presynaptic Nerve
Terminal: Analysis by Quantitative Immunocolocalization. Journal of Neuroscience 24, 4070-4081.
In Fiji this and other methods have been implemented in the latest Coloc 2 plugin.
A “scatter plot” with red
versus green intensities (ch1:
red, ch2: green), colours as in
the original
green
… colours indicating the
frequencies of the scatter
points (white = highest)
red
The PDM value is the Product of the Differences from the
Mean, i.e. for each pixel:
PDM = (red intensity- mean red intensity)
x (green intensity – mean green intensity)
( R − R)*(G − G )
Note: In statistics PDM is called cross product deviation
Colocalisation Highlighter
Red: mRFP-LimE-delta, a marker for Factin, Green: GFP-Coronin, a protein
involved in F-actin degradation
ICA plots
red
green
( R − R)*(G − G )
Two uncorrelated
channels:
Random scatter plot and
corresponding ICA
analysis
cov( R, G ) =
N
∑ ( R − R) *(G − G) = 0
i
i =1
i
( R − R)*(G − G )
Y-axes: red or green intensities
X-axes: positive PDM values: red/green are dependent
Negative PDM values: red/green are segregated
Rr: Pearson’s correlation coefficient
-1: perfect exclusion
0: random localisation
+1: perfect correlation
High values are indicative, while for images in general low and
negative values can be difficult to interpret
A number of other coefficients like R (Mander’s Overlap
coefficient) are used to assay colocalisation. Ususally it is wise to
test the quality of the colocalisation analysis by translating one
of the channels in x and y direction, or by scrambling the pixels.
