Supplementary Data Characterization of small molecule ligands. Compound 2G:
advertisement

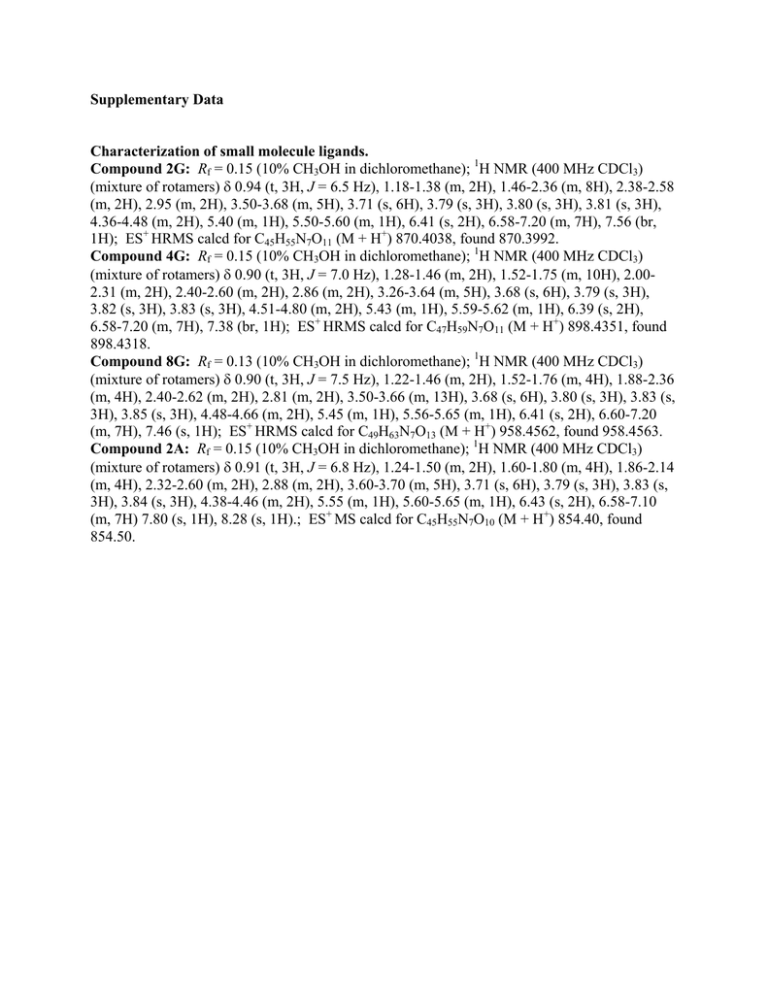
Supplementary Data Characterization of small molecule ligands. Compound 2G: Rf = 0.15 (10% CH3OH in dichloromethane); 1H NMR (400 MHz CDCl3) (mixture of rotamers) δ 0.94 (t, 3H, J = 6.5 Hz), 1.18-1.38 (m, 2H), 1.46-2.36 (m, 8H), 2.38-2.58 (m, 2H), 2.95 (m, 2H), 3.50-3.68 (m, 5H), 3.71 (s, 6H), 3.79 (s, 3H), 3.80 (s, 3H), 3.81 (s, 3H), 4.36-4.48 (m, 2H), 5.40 (m, 1H), 5.50-5.60 (m, 1H), 6.41 (s, 2H), 6.58-7.20 (m, 7H), 7.56 (br, 1H); ES+ HRMS calcd for C45H55N7O11 (M + H+) 870.4038, found 870.3992. Compound 4G: Rf = 0.15 (10% CH3OH in dichloromethane); 1H NMR (400 MHz CDCl3) (mixture of rotamers) δ 0.90 (t, 3H, J = 7.0 Hz), 1.28-1.46 (m, 2H), 1.52-1.75 (m, 10H), 2.002.31 (m, 2H), 2.40-2.60 (m, 2H), 2.86 (m, 2H), 3.26-3.64 (m, 5H), 3.68 (s, 6H), 3.79 (s, 3H), 3.82 (s, 3H), 3.83 (s, 3H), 4.51-4.80 (m, 2H), 5.43 (m, 1H), 5.59-5.62 (m, 1H), 6.39 (s, 2H), 6.58-7.20 (m, 7H), 7.38 (br, 1H); ES+ HRMS calcd for C47H59N7O11 (M + H+) 898.4351, found 898.4318. Compound 8G: Rf = 0.13 (10% CH3OH in dichloromethane); 1H NMR (400 MHz CDCl3) (mixture of rotamers) δ 0.90 (t, 3H, J = 7.5 Hz), 1.22-1.46 (m, 2H), 1.52-1.76 (m, 4H), 1.88-2.36 (m, 4H), 2.40-2.62 (m, 2H), 2.81 (m, 2H), 3.50-3.66 (m, 13H), 3.68 (s, 6H), 3.80 (s, 3H), 3.83 (s, 3H), 3.85 (s, 3H), 4.48-4.66 (m, 2H), 5.45 (m, 1H), 5.56-5.65 (m, 1H), 6.41 (s, 2H), 6.60-7.20 (m, 7H), 7.46 (s, 1H); ES+ HRMS calcd for C49H63N7O13 (M + H+) 958.4562, found 958.4563. Compound 2A: Rf = 0.15 (10% CH3OH in dichloromethane); 1H NMR (400 MHz CDCl3) (mixture of rotamers) δ 0.91 (t, 3H, J = 6.8 Hz), 1.24-1.50 (m, 2H), 1.60-1.80 (m, 4H), 1.86-2.14 (m, 4H), 2.32-2.60 (m, 2H), 2.88 (m, 2H), 3.60-3.70 (m, 5H), 3.71 (s, 6H), 3.79 (s, 3H), 3.83 (s, 3H), 3.84 (s, 3H), 4.38-4.46 (m, 2H), 5.55 (m, 1H), 5.60-5.65 (m, 1H), 6.43 (s, 2H), 6.58-7.10 (m, 7H) 7.80 (s, 1H), 8.28 (s, 1H).; ES+ MS calcd for C45H55N7O10 (M + H+) 854.40, found 854.50. Supplementary Figure 1. Screening round 7 clones by nitrocellulose filter binding assays. Each labeled RNA was incubated with buffer (lane 1), 500 nM tFKBP*3R (lane 2) or varying concentrations of tFKBP*3R-2G complex (lanes 3-6), and the resulting solution was applied to the filter. Boxed sequences display small molecule-enhanced binding. Specifically, these sequences show at least a two-fold greater signal at 5 µM tFKBP*3R-2G over background and at least a 2.5-fold greater signal at 5 µM tFKBP*3R2G over protein alone in at least one of duplicate measurements. Sequences in red have an average Kd (duplicate measurement) below 50 nM (see Supplementary Table 1). Supplementary Figure 2. Specificity of high-affinity aptamers for tFKBP*3R and 2G. Nitrocellulose filter-binding experiments were used to determine whether structurally similar small molecules would induce protein-small molecule-RNA complex formation as efficiently as 2G. Aptamers were also tested for their ability to differentiate between tFKBP* and tFKBP*3R. (A) A representative nitrocellulose filterbinding assay. Note the increased level of tFKBP*-2G-s36 binding (arrow). (B) Quantification of the data in (A), as a percent of tFKBP*3R-2G-aptamer binding. Values reflect the average of quadruplicate measurements. Supplementary Figure 3 2G-s23 and tFKBP*3R-2G-s23 Kd measurements. (A) The 2G-s23 affinity was determined by nitrocellulose filter binding assays, and a representative blot is shown. Triplicate measurements indicate a Kd of 4.6 ± 0.8 µM. Binding of 2G to one of the point mutant s23 RNA molecules (G72A) that has a greatly diminished capacity to form a ternary complex was also assayed. At 50 µM 2G, binding of G72A is barely detectable, and at 10 µM is not detectable, implying that binding of s23 to 2G is specific. (B) Representative blot of tFKBP*3R-2G-s23 binding. The Kd for ternary complex formation of 4.3 ± 0.5 nM is the average of three independent measurements. Note that no significant binding of s23 to 5 µM tFKBP*3R can be seen. Supplementary Table 1. Estimate of aptamer affinities for tFKBP*3R-2G Aptamer s4 s5 s6 s8 s11 s14 s16 s20 s23 s25 s28 s29 s30 s34 s36 s44a Kd (nM) 79.6 ± 2.6 57.2 ± 6.9 314 ± 3 132 ± 29 <5 <5 10.5 ± 1.9 8.9 ± 4.9 <5 <5 <5 <5 <5 <5 <5 <5 Sequence of Variable Region UACUAUAGGAUGGUCAGGGUCUGACCAACGGUGGGUGGUGAGAGCUAUAGUUGGUGGUC UUGCAGGCCGGUAUGAACGGUCGGGGGGUUGGUACGCGUCGCGGUAGGCGGGCCGGUCAU GAAAAUUUAAUGCGUUGGUAAUGGUUGGGGAUUGUCAAUGUUACUCAGGAAUACGUACGGG UCGCGUUAGACGUGGUAAAUGGGACUCGCUCUGAGUUUAGACCGUGGGUGGUGCGUUGGCGG GAUUUAAGUUAAGAGGGAGGGUCAUGUGUGCCGGUGUGAUGCGGUACUGAUCCAAG UUGGUGUGGGCGUGACUAUCUCGGGUCUUUUGGGGAUAGUAUGGAAUGAUGAUCCUUGUGC GGUGACUGCGGCGGCGGCGAUUCGCUAUCCCCGGGUAUUAUGCUUCUGGAUCUACUCUGU UAGAGUGGUGAAGCGGGAUGUGAUUUUCAAGUUCGUUGGGACCAAGAGGCAGAGCCAAC UCAUUUCAUUGUGGCGGUGCAGUCAAAUGUGAUGCUUCGUUCAGUGACGGGAGGGUUGUGAG AGCGGUGGGUUGCUGAGGCUUUGGAAAGUGUGCAAAGUGCUUUGUGUCGUAUCCGGUGU AAGAUGGCGGGUGGAGUAUGGCUUUCGGCGGUAUGCCGUGUGGAGAAGUAUGUUCAGUGGUCCU AGUAUGCAUCCGGAGUUAGACUCCGAUGGUGGCGAGGGCGUGGUAGACUGGGUGCGAU UCACGGAUGCAGAGGACGGAUGGAGCCAGGUGAAAGGAUUGGCUGAGUAGCUGUGACGA AAUGGUGGUAAGUGGGUGGCUGCUUAGGGGCUUGAGAAACGAGUUCCAAGGCGGAUGUGU AUUUGAUGUUUUGGUUAUGUCCAGACCGUACCCUACAGUGGUGGCAUGUGGCGNGUGGUUA UUCGCGAGCCUAACGUUUAGGAGGGUAUGAAGUAUAUGGUGGAAGGGGACAGUUUUCAUA Duplicate nitrocellulose filter binding assays with the 16 RNA aptamers and tFKBP*3R-2G were quantified and binding affinities were calculated. aThe Kd for s44 represents only one measurement.


