Lecture - CO 2 and Energy
advertisement

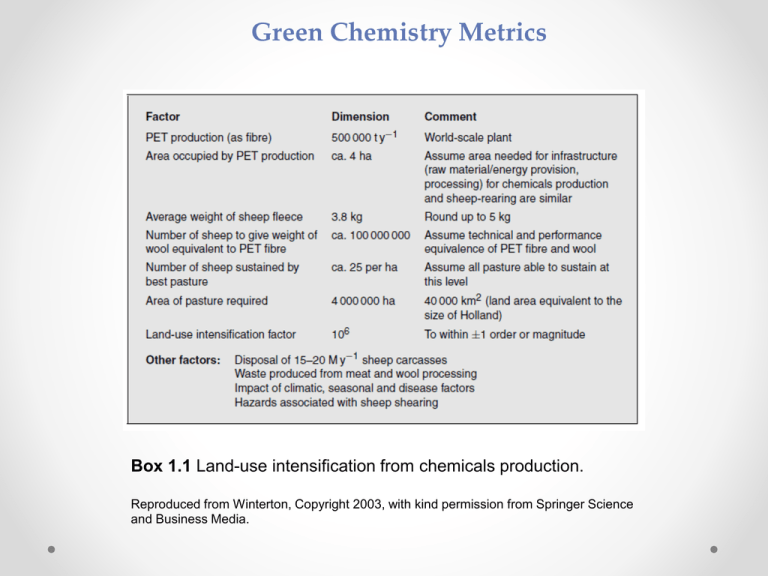
Green Chemistry Metrics Box 1.1 Land-use intensification from chemicals production. Reproduced from Winterton, Copyright 2003, with kind permission from Springer Science and Business Media. and CO2 content of fuels Fuel FW kJ/mol kJ/g molCO2/mol molCO2/kg molCO2/MJ Hydrogen 2 -286 -143 0 0 0 Methane 16 -890 -55.6 1 63 1.12 Isooctane 114 -5461 -47.9 8 70 1.46 Benzene 78 -3268 -41.9 6 77 1.84 Methanol 32 -726 -22.7 1 31 1.38 Ethanol 46 -1368 -29.7 2 43 1.46 Carbon 12 -394 -32.8 1 83 2.54 Biodiesel 298 -11962 -40.1 19 64 1.59 NIST Chemistry webbook: http://webbook.nist.gov/chemistry/ Energy Issues Lewis, N. S.; Nocera, D. G. Proc. Natl. Acad. Sci. USA 2007, 103, 15729-15735. Cho, A. Science 2010, 329, 786-787 http://mageep.wustl.edu/Program2010/Presentations/Other/Calabrese.pdf http://en.wikipedia.org/wiki/World_energy_resources_and_consumption World Energy Demand 2100: 40-50 TW 2050: 25-30 TW 25.00 World Energy Demand total energy gap ~ 14 TW by 2050 ~ 33 TW by 2100 15.00 industrial 10.00 developing 5.00 50 US 0.00 1970 1990 2010 ee/fsu 40 2030 30 % TW 20.00 oil World Fuel Mix gas 2001 coal 20 EIA Intl Energy Outlook 2004 http://www.eia.doe.gov/oiaf/ieo/index.html Hoffert et al Nature 395, 883,1998 nucl renew 10 0 85% fossil Fossil Fuels and Greenhouse Gases 325 300 275 CO2 in 2004: 380 ppmv 800 -- CO2 -- CH4 -- ∆T 700 + 4 ∆T relative to present (°C) CO2 CH4 (ppmv) (ppmv) 0 600 250 500 - 4 200 400 - 8 175 300 225 100 400 200 300 Thousands of years before present (Ky BP) 0 Climate Change 2001: T he Scientific Basis, Fig 2.22 Intergovernmental Panel on Climate Change, 2001 http://www.ipcc.ch N. Oreskes, Science 306, 1686, 2004 D. A. Stainforth et al, Nature 433, 403, 2005 Relaxation time transport of CO2 or heat to deep ocean: >3000 years • • • ~ 14 TW of additional power by 2050 Energy Gap ~ 33 TW of additional power by 2100 2004 capacity: 13 TW fossil energy after oil production peaks, switch to gas and coal capture/store 22 Gtonnes of CO2/yr (current emissions) • 12,500 km3 at atmospheric pressure = volume of Lake Superior • 600 times CO2 injected in oil wells/yr to spur production • 100 times the natural gas drawn in and out of geologic storage/yr to smooth demand • 20,000 times CO2 stored/yr in Norway’s Sleipner offshore reservior • no leaks: 1% leak rate nullifies storage in 100 yrs nuclear energy 14,000 1 GWe fission reactors - 1 new reactor/day for 38 years Renewable Sources Solar • Wind • 1.2 x 10⁵ TW at Earth surface 600 TW practical 2-4 TW extractable Tide/Ocean Currents 2 TW gross Geothermal 12 TW gross over land small fraction recoverable energy gap ~ 14 TW by 2050 ~ 33 TW by 2100 Biomass 5-7 TW gross all cultivatable land not used for food Hydroelectric 4.6 TW gross 1.6 TW technically feasible 0.9 TW economically feasible 0.6 TW installed capacity Reaction Conditions Our typical reaction conditions: • 35-55 bar CO2 and 80°C • Clearly in the subcritical region • Historical CO2 record derived from a spline fit (20 year cutoff) of the Law Dome DE08 and DE08-2 ice cores (link) • Wikipedia: Carbon dioxide in the Earth's atmosphere (link) Efficiencies of Some Energy Conversion Devices and Device SystemsConversion process Efficiency Electric generators (mechanical -> electrical) 70-99% Electric motor (electrical -> mechanical) 50-90% Gas furnace (chemical -> thermal) 70-95% Wind turbine (mechanical -> electrical) 35-50% Fossil fuel power plant (chemical -> thermal -> mechanical -> electrical) 30-40% Nuclear power plant (nuclear -> thermal -> mechanical -> electrical) 30-35% Automobile engine (chemical -> thermal -> mechanical) 20-30% Fluorescent lamp (electrical -> light) 20% Incandescent lamp (electrical -> light) 5% Solar cell (light -> electrical) 5-28% Fuel cell (chemical “Energy-Its -> electrical) 40-60% Use and the Environment”, 4th Ed. 2006 Correlation between carbon dioxide concentrations and the earth’s temperature over the past 400,000 years Global concentration of methane gas over the past 1,000 years Distribution of carbon dioxide emissions from fossil fuels, 2002 Annual per capita carbon dioxide (CO2) releases for the 15 countries with the highest total emissions, 2000. Ross Ice Shelf Carbon cycle of the earth Potential feedbacks to global warming Variations in temperature, CO2, and dust from the Vostok ice core over the last 400,000 years


