Review - Exam 1 √ x + 100 − 10
advertisement
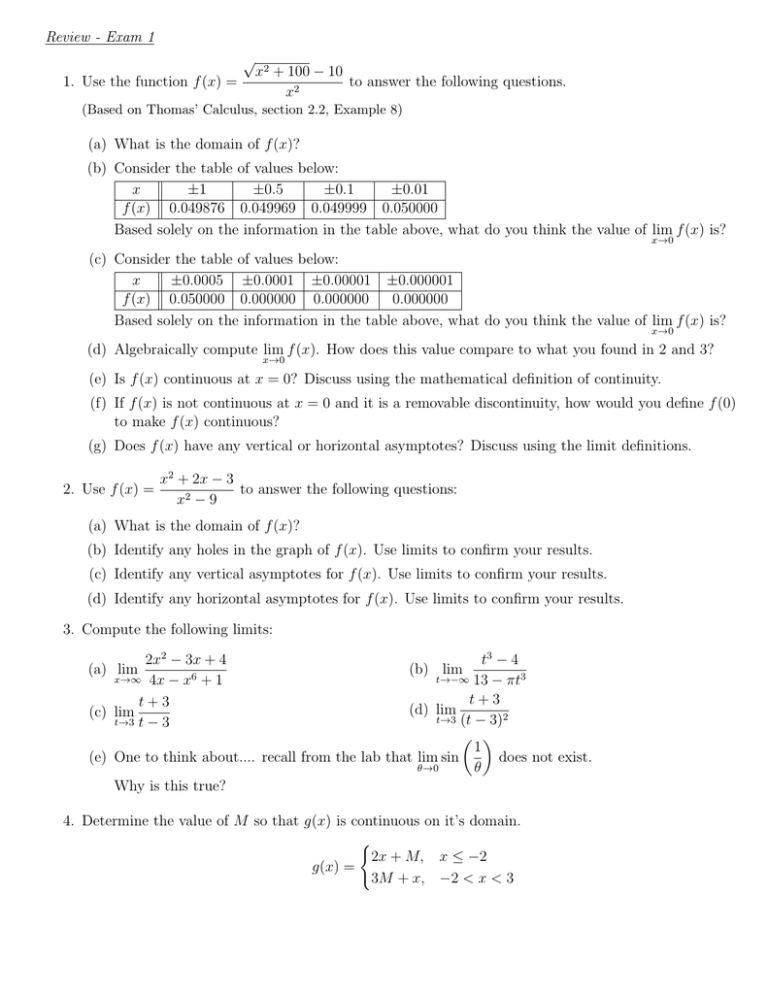
Review - Exam 1 √ 1. Use the function f (x) = x2 + 100 − 10 to answer the following questions. x2 (Based on Thomas’ Calculus, section 2.2, Example 8) (a) What is the domain of f (x)? (b) Consider the table of values below: x ±1 ±0.5 ±0.1 ±0.01 f (x) 0.049876 0.049969 0.049999 0.050000 Based solely on the information in the table above, what do you think the value of lim f (x) is? x→0 (c) Consider the table of values below: x ±0.0005 ±0.0001 ±0.00001 ±0.000001 f (x) 0.050000 0.000000 0.000000 0.000000 Based solely on the information in the table above, what do you think the value of lim f (x) is? x→0 (d) Algebraically compute lim f (x). How does this value compare to what you found in 2 and 3? x→0 (e) Is f (x) continuous at x = 0? Discuss using the mathematical definition of continuity. (f) If f (x) is not continuous at x = 0 and it is a removable discontinuity, how would you define f (0) to make f (x) continuous? (g) Does f (x) have any vertical or horizontal asymptotes? Discuss using the limit definitions. 2. Use f (x) = x2 + 2x − 3 to answer the following questions: x2 − 9 (a) What is the domain of f (x)? (b) Identify any holes in the graph of f (x). Use limits to confirm your results. (c) Identify any vertical asymptotes for f (x). Use limits to confirm your results. (d) Identify any horizontal asymptotes for f (x). Use limits to confirm your results. 3. Compute the following limits: 2x2 − 3x + 4 x→∞ 4x − x6 + 1 t+3 (c) lim t→3 t − 3 t3 − 4 t→−∞ 13 − πt3 t+3 (d) lim t→3 (t − 3)2 1 (e) One to think about.... recall from the lab that lim sin does not exist. θ→0 θ Why is this true? (a) lim (b) lim 4. Determine the value of M so that g(x) is continuous on it’s domain. ( 2x + M, x ≤ −2 g(x) = 3M + x, −2 < x < 3 2t + 5, t ≤ −2 5. Consider g(t) = 3 + t, −2 < t < 3 4, t≥3 (a) Sketch the graph of g(t) (b) Using the definition of continuity, determine if g(t) is continuous at all points in its domain. If there are points of discontinuities, discuss these using the definition of continuity. ( x2 , −1 ≤ x < 1 6. The following parts of this question are about the function f (x) = 2 − x, x > 1 (a) Show algebraically that f (x) has a limit L at x0 = 1 and find this limit. (b) Sketch an accurate graph of the function in the axes below. Be sure that your graph reflects the function’s domain, has the correct shape, and key points are correctly labeled. (c) Suppose we will allow a tolerance of 0.25 within L for the function values (i.e. = 0.25). Algebraically find the interval of x-values will ensure the function values lie within this tolerance window. Write any decimals to 3 places. (d) On the graph you drew in (b), label the following: i. The limit, L, that you found in (a). Your label should be placed on the y-axis and labeled (i). ii. The tolerance window around L. Your label should be placed on the y-axis and labeled (ii). iii. The window about x0 = 1 that you found in (c). Your label should be placed on the x-axes and labeled (iii). (e) What is the maximum amount of error that can occur on either side of x0 = 1 so that the function values still like within 0.25 of L? (i.e. what is the δ value?) 7. Compute the following limits (a) (b) (c) (d) (e) (f) |x + 5| x→−5 x2 − 25 x−4 lim √ x→4 x−2 1 − cos(2x) + 4x lim x→0 sin(x) + x x−3 lim x→3 x2 + x − 12 cot 2θ lim θ→π cos θ 2 |t − 1| lim t→1− t2 − 1 lim − b−1 x2 − 6x − 16 (m) lim b→1 1 − 1 x→8 x2 + x − 72 b t−3 t t (n) lim 2 + sin lim cos t→−3 t −9 t→π 3 6 7x x−1 (o) lim 1 1 lim √ x→0 − 4+x x→1 x−1 4−x √ y2 − 1 x + 6x (p) lim lim y→−1 |2y + 2| x→∞ x − 12 1 1 − 3x2 + 2x + 1 lim b 4 (q) lim b→4 b − 4 x→∞ −9x2 + 7x |x − 1| 8x − 1 lim+ 2 (r) lim x→∞ 7x5 + 1 x→1 x − 1 (g) lim (h) (i) (j) (k) (l) (v) lim tan(x) (s) lim (9x + 1) x→∞ lim g(y) = y→3 x→π/2 √ (t) lim h→−5 t2 + 4t − 12 t→2 t2(− 2t y 2 + 5 y < −2 (x) g(y) = 3 − 3y y ≥ −2 h+6−1 h+5 (w) lim sin θ θ→0 1 + cos θ (u) lim lim g(y) = y→−2 8. Sketch the graph of a function having the following properties: • lim f (x) = 0 • x→−∞ • lim f (x) = ∞ x→−2+ x→−2 • lim+ f (x) = ∞ • f (0) = −2 • lim f (x) = 1 x→0 • f (−2) DNE • lim− f (x) = 0 lim − f (x) = −3 • lim+ f (x) = −2 • lim− f (x) = −∞ x→1 x→∞ x→1 x→0 Discuss all discontinuities (be sure to use the mathematical definition of continuity) Discuss all vertical and horizontal asymptotes (be sure to use the limit definitions). 9. Indicate whether each of the following statements is True or False. If the statement is true, explain how you know it’s true. If it is false, give a counterexample and explain why it is a counterexample. (A counterexample is an example of a function for which the “if” part of the statement is true, but the “then” part is false.) A graph with an explanation can be used as a counterexample. If you use a term or phrase such as continuity or average rate of change, be sure to state the definition of the term or phrase that you used. (a) If f (π) = π then lim− f (x) = π. x→π (b) If f (π) = π and f (x) is continuous, then lim− f (x) = π. x→π (c) If the function f (x) has y = 2 as a horizontal asymptote, then there is not an x-value such that f (x) = 2. (d) If the function f (x) has x = 2 as a vertical asymptote, then f (2) cannot exist. (e) If lim g(x) = −3, then lim g(x) = −3. x→−∞ x→∞ (f) If h(−2) does not exist, lim h(x) cannot exist x→−2 (g) If lim h(x) does not exist, then h(17) cannot exist. x→17 (h) A function f (x) can have x = 2 as a vertical asymptote and also have the point (2, 3) on the graph of f (x). (i) If lim h(t) does not exist, then h(0) cannot exist. t→0 (j) Given a function G(x) such that G(1) = −1 and G(3) = 1, there must be a number x0 = C in between x = 1 and x = 3 (i.e. 1 ≤ C ≤ 3) where G(C) = 0. 10. Use f (x) = x2 − x to answer the following. (a) Sketch the graph of f (x) (b) Find the average rate of change of f (x) from x1 to x2 : i. ii. iii. iv. x1 x1 x1 x1 = −1, = −1, = −1, = −1, x2 x2 x2 x2 =0 = −0.9 = −0.99 = −0.999 (c) Illustrate and label on the graph above each of the following quantities. Then write a short statement explaining in terms of your graph what each quantity means (1-2 sentences for each quantity): i. ii. iii. iv. (−1, f (−1)) (−1 + h, f (−1 + h)) h f (−1 + h) − f (−1) f (−1 + h) − f (−1) v. Draw the line that is related to the difference quotient: h How is this difference quotient related to the line you drew? (d) Explain why the limit is needed to find the slope of the tangent line. (Why can’t we just use arithmetic and algebra?) (e) Based on the work you have done in this problem, what would you predict the instantaneous rate of change to be at x = −1?
