Graphs of Total Soluble Solids:Acid Ratio for TDE Mandarin Hybrids
advertisement

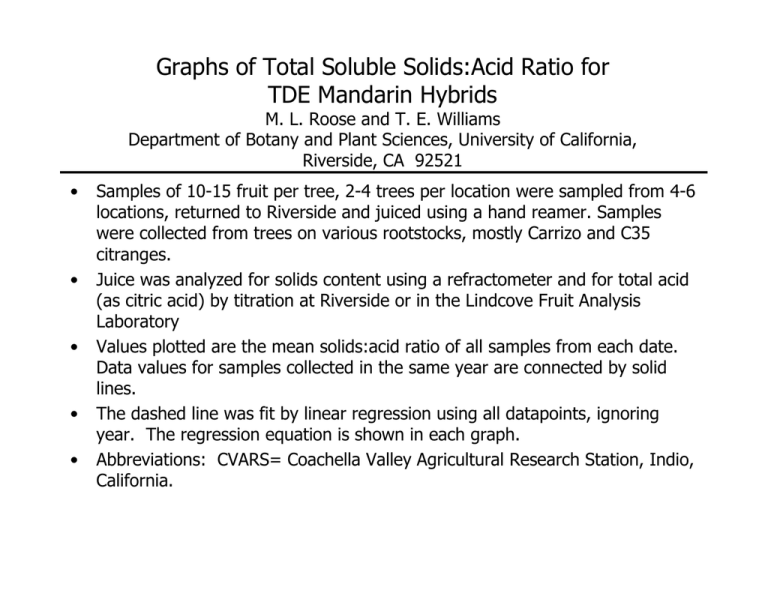
Graphs of Total Soluble Solids:Acid Ratio for TDE Mandarin Hybrids M. L. Roose and T. E. Williams Department of Botany and Plant Sciences, University of California, Riverside, CA 92521 • • • • • Samples of 10-15 fruit per tree, 2-4 trees per location were sampled from 4-6 locations, returned to Riverside and juiced using a hand reamer. Samples were collected from trees on various rootstocks, mostly Carrizo and C35 citranges. Juice was analyzed for solids content using a refractometer and for total acid (as citric acid) by titration at Riverside or in the Lindcove Fruit Analysis Laboratory Values plotted are the mean solids:acid ratio of all samples from each date. Data values for samples collected in the same year are connected by solid lines. The dashed line was fit by linear regression using all datapoints, ignoring year. The regression equation is shown in each graph. Abbreviations: CVARS= Coachella Valley Agricultural Research Station, Indio, California. Solids:Acid of TDE2 at Santa Paula, CA 28 y = 0.0414x - 1520.6 R2 = 0.3692 20 16 2000 12 1999 1998 2001 8 Sampling date 5/6 4/5 3/5 2/2 1/2 12/2 4 11/1 Solids:Acids 24 Solids:Acid of TDE2 at Valley Center, CA 28 y = 0.0844x - 3111.5 R2 = 0.7808 20 16 1999 2000 12 2001 1997 8 1998 Sampling date 5/6 4/5 3/5 2/2 1/2 12/2 4 11/1 Solids:Acids 24 Solids:Acid of TDE2 at Ojai, CA 28 y = 0.0673x - 2475.7 R2 = 0.8235 20 1998 16 1999 1997 12 2001 8 2000 Sampling date 5/6 4/5 3/5 2/2 1/2 12/2 4 11/1 Solids:Acids 24 Solids:Acid of TDE2 at Thermal, CA 28 y = 0.0721x - 2650.2 R2 = 0.8015 20 1998 16 2001 1999 12 8 Sampling date 5/6 4/5 3/5 2/2 1/2 12/2 4 11/1 Solids:Acids 24 Solids:Acid of TDE2 at CVARS 28 y = 0.0833x - 3060.5 R2 = 0.7891 20 1998 16 1999 12 8 Sampling date 5/6 4/5 3/5 2/2 1/2 12/2 4 11/1 Solids:Acids 24 Solids:Acid of TDE3 at Santa Paula, CA 28 y = 0.1017x - 3746.3 R2 = 0.6341 20 1999 2000 16 12 1998 8 Sampling date 5/6 4/5 3/5 2/2 1/2 12/2 4 11/1 Solids:Acids 24 Solids:Acid of TDE3 at CVARS 28 y = 0.0806x - 2959.8 R2 = 0.7501 20 1999 16 2001 12 2000 8 Sampling date 5/6 4/5 3/5 2/2 1/2 12/2 4 11/1 Solids:Acids 24 Solids:Acid of TDE3 at Lindcove, CA 28 y = 0.0735x - 2702.9 R2 = 0.8934 20 1998 1999 16 1997 12 2001 8 Sampling date 5/6 4/5 3/5 2/2 1/2 4 12/2 2000 11/1 Solids:Acids 24 Solids:Acid of TDE3 at Valley Center, CA 28 y = 0.0463x - 1700.5 R2 = 0.4875 20 1998 16 1997 12 1999 2001 8 2000 Sampling date 5/30 4/30 3/31 3/1 1/30 12/31 12/1 4 11/1 Solids:Acids 24 Solids:Acid of TDE3 at Orange Cove, CA 28 y = 0.0763x - 2808.9 R2 = 0.8148 20 1999 16 1997 1998 12 8 2000 Sampling date 5/6 4/5 3/5 2/2 1/2 12/2 4 11/1 Solids:Acids 24 Solids:Acid of TDE3 at Ojai, CA 28 y = 0.0763x - 2805 R2 = 0.9077 20 1999 16 12 2001 2000 8 Sampling date 5/6 4/5 3/5 2/2 1/2 12/2 4 11/1 Solids:Acids 24 1998 Solids:Acid of TDE4 at Santa Paula, CA 28 y = 0.0491x - 1804.5 R2 = 0.487 20 16 2000 12 1999 1998 8 2001 Sampling date 5/6 4/5 3/5 2/2 1/2 12/2 4 11/1 Solids:Acids 24 Solids:Acid of TDE4 at Lindcove, CA 28 y = 0.0873x - 3212.6 R2 = 0.7903 20 1998 2001 16 1999 12 8 2000 1997 Sampling date 5/6 4/5 3/5 2/2 1/2 12/2 4 11/1 Solids:Acids 24 Solids:Acid of TDE4 at Orange Cove, CA 28 y = 0.0799x - 2942.2 R2 = 0.7981 20 2000 16 1998 1997 12 1999 8 Sampling date 5/6 4/5 3/5 2/2 1/2 12/2 4 11/1 Solids:Acids 24 Solids:Acid of TDE4 at Ojai, CA 28 y = 0.0619x - 2276.5 R2 = 0.7992 20 1998 16 1999 12 2001 8 2000 Sampling date 5/6 4/5 3/5 2/2 1/2 12/2 4 11/1 Solids:Acids 24


