An Engineering Approach to Study Food Digestion T.Moxon , C. Latty
advertisement
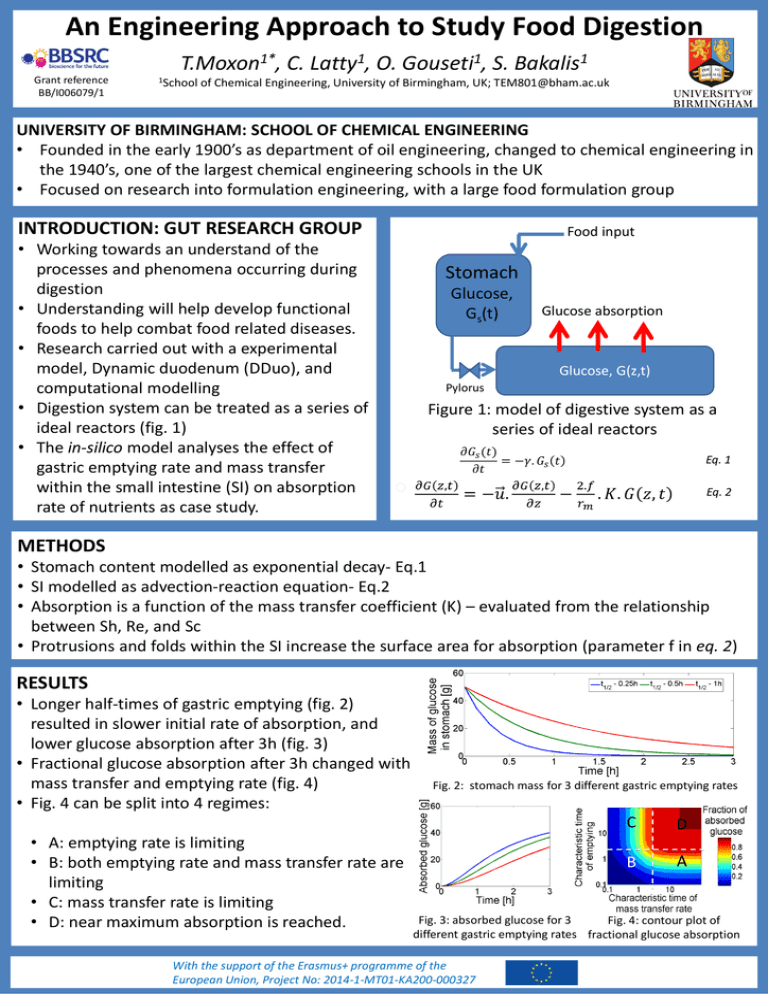
An Engineering Approach to Study Food Digestion T.Moxon1*, C. Latty1, O. Gouseti1, S. Bakalis1 Grant reference BB/I006079/1 1School of Chemical Engineering, University of Birmingham, UK; TEM801@bham.ac.uk UNIVERSITY OF BIRMINGHAM: SCHOOL OF CHEMICAL ENGINEERING • Founded in the early 1900’s as department of oil engineering, changed to chemical engineering in the 1940’s, one of the largest chemical engineering schools in the UK • Focused on research into formulation engineering, with a large food formulation group INTRODUCTION: GUT RESEARCH GROUP • Working towards an understand of the processes and phenomena occurring during digestion • Understanding will help develop functional foods to help combat food related diseases. • Research carried out with a experimental model, Dynamic duodenum (DDuo), and computational modelling • Digestion system can be treated as a series of ideal reactors (fig. 1) • The in-silico model analyses the effect of gastric emptying rate and mass transfer within the small intestine (SI) on absorption rate of nutrients as case study. Food input Stomach Glucose, Gs(t) Glucose absorption Glucose, G(z,t) Pylorus Figure 1: model of digestive system as a series of ideal reactors Eq. 1 Eq. 2 METHODS • Stomach content modelled as exponential decay- Eq.1 • SI modelled as advection-reaction equation- Eq.2 • Absorption is a function of the mass transfer coefficient (K) – evaluated from the relationship between Sh, Re, and Sc • Protrusions and folds within the SI increase the surface area for absorption (parameter f in eq. 2) RESULTS • Longer half-times of gastric emptying (fig. 2) resulted in slower initial rate of absorption, and lower glucose absorption after 3h (fig. 3) • Fractional glucose absorption after 3h changed with mass transfer and emptying rate (fig. 4) • Fig. 4 can be split into 4 regimes: • A: emptying rate is limiting • B: both emptying rate and mass transfer rate are limiting • C: mass transfer rate is limiting • D: near maximum absorption is reached. Fig. 2: stomach mass for 3 different gastric emptying rates C D B A Fig. 3: absorbed glucose for 3 Fig. 4: contour plot of different gastric emptying rates fractional glucose absorption With the support of the Erasmus+ programme of the European Union, Project No: 2014-1-MT01-KA200-000327
