A DLA-based model for the network's contribution to the total... by Kim Thibault, Physics department, Université de Montréal Abstract
advertisement

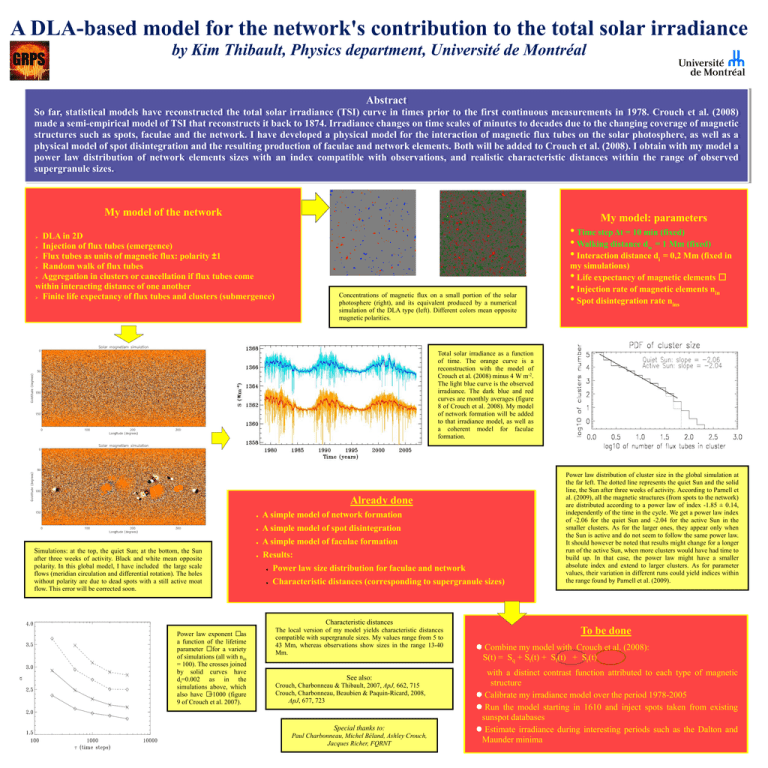
A DLA-based model for the network's contribution to the total solar irradiance by Kim Thibault, Physics department, Université de Montréal Abstract So far, statistical models have reconstructed the total solar irradiance (TSI) curve in times prior to the first continuous measurements in 1978. Crouch et al. (2008) made a semi-empirical model of TSI that reconstructs it back to 1874. Irradiance changes on time scales of minutes to decades due to the changing coverage of magnetic structures such as spots, faculae and the network. I have developed a physical model for the interaction of magnetic flux tubes on the solar photosphere, as well as a physical model of spot disintegration and the resulting production of faculae and network elements. Both will be added to Crouch et al. (2008). I obtain with my model a power law distribution of network elements sizes with an index compatible with observations, and realistic characteristic distances within the range of observed supergranule sizes. My model of the network My model: parameters • Time step Δt = 10 min (fixed) • Walking distance dw = 1 Mm (fixed) • Interaction distance di = 0,2 Mm (fixed in DLA in 2D Injection of flux tubes (emergence) Flux tubes as units of magnetic flux: polarity ±1 Random walk of flux tubes Aggregation in clusters or cancellation if flux tubes come within interacting distance of one another Finite life expectancy of flux tubes and clusters (submergence) Concentrations of magnetic flux on a small portion of the solar photosphere (right), and its equivalent produced by a numerical simulation of the DLA type (left). Different colors mean opposite magnetic polarities. my simulations) • Life expectancy of magnetic elements • Injection rate of magnetic elements nin • Spot disintegration rate nins Total solar irradiance as a function of time. The orange curve is a reconstruction with the model of Crouch et al. (2008) minus 4 W m-2. The light blue curve is the observed irradiance. The dark blue and red curves are monthly averages (figure 8 of Crouch et al. 2008). My model of network formation will be added to that irradiance model, as well as a coherent model for faculae formation. Already done Simulations: at the top, the quiet Sun; at the bottom, the Sun after three weeks of activity. Black and white mean opposite polarity. In this global model, I have included the large scale flows (meridian circulation and differential rotation). The holes without polarity are due to dead spots with a still active moat flow. This error will be corrected soon. ● A simple model of network formation ● A simple model of spot disintegration ● A simple model of faculae formation ● Results: ● Power law size distribution for faculae and network ● Characteristic distances (corresponding to supergranule sizes) Power law distribution of cluster size in the global simulation at the far left. The dotted line represents the quiet Sun and the solid line, the Sun after three weeks of activity. According to Parnell et al. (2009), all the magnetic structures (from spots to the network) are distributed according to a power law of index -1.85 ± 0.14, independently of the time in the cycle. We get a power law index of -2.06 for the quiet Sun and -2.04 for the active Sun in the smaller clusters. As for the larger ones, they appear only when the Sun is active and do not seem to follow the same power law. It should however be noted that results might change for a longer run of the active Sun, when more clusters would have had time to build up. In that case, the power law might have a smaller absolute index and extend to larger clusters. As for parameter values, their variation in different runs could yield indices within the range found by Parnell et al. (2009). Characteristic distances Power law exponent as a function of the lifetime parameter for a variety of simulations (all with nin = 100). The crosses joined by solid curves have di=0.002 as in the simulations above, which also have =1000 (figure 9 of Crouch et al. 2007). The local version of my model yields characteristic distances compatible with supergranule sizes. My values range from 5 to 43 Mm, whereas observations show sizes in the range 13-40 Mm. See also: Crouch, Charbonneau & Thibault, 2007, ApJ, 662, 715 Crouch, Charbonneau, Beaubien & Paquin-Ricard, 2008, ApJ, 677, 723 Special thanks to: Paul Charbonneau, Michel Béland, Ashley Crouch, Jacques Richer, FQRNT To be done Combine my model with Crouch et al. (2008): S(t) = Sq + St(t) + Sf(t) + Sr(t) with a distinct contrast function attributed to each type of magnetic structure Calibrate my irradiance model over the period 1978-2005 Run the model starting in 1610 and inject spots taken from existing sunspot databases Estimate irradiance during interesting periods such as the Dalton and Maunder minima


![David H. Hathaway [], NASA Marshall Space Flight](http://s2.studylib.net/store/data/013086416_1-3bb180e57b94b61591af05ec55939ff6-300x300.png)
