All Students
advertisement

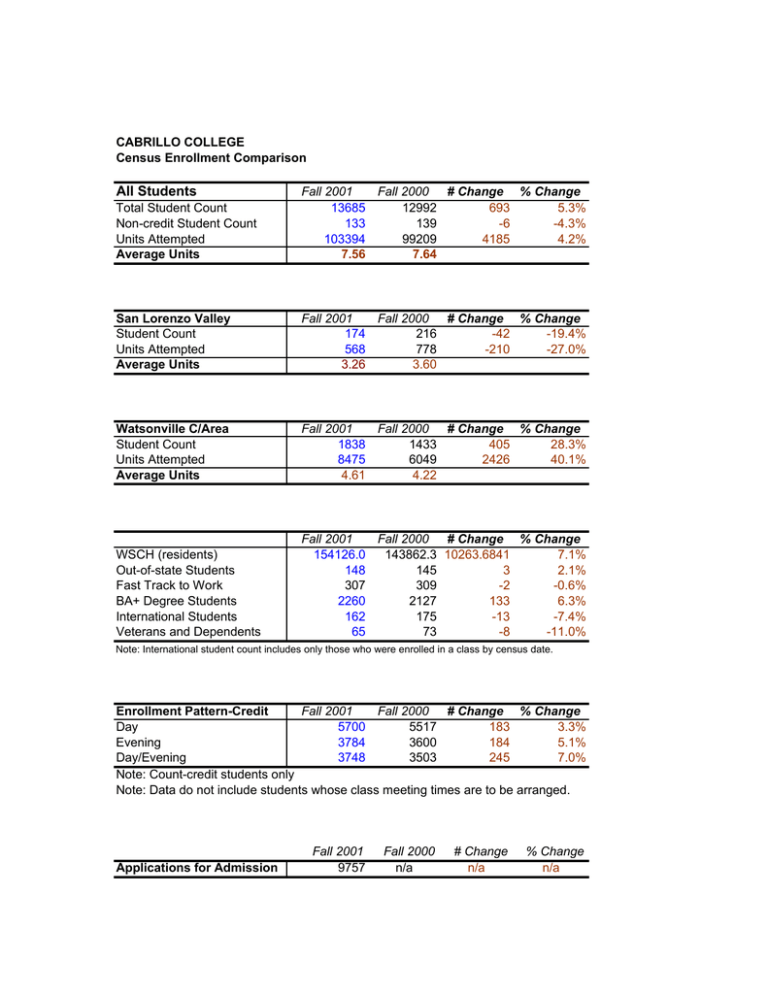
CABRILLO COLLEGE Census Enrollment Comparison All Students Total Student Count Non-credit Student Count Units Attempted Average Units Fall 2001 Fall 2000 # Change % Change 13685 12992 693 5.3% 133 139 -6 -4.3% 103394 99209 4185 4.2% 7.56 7.64 San Lorenzo Valley Student Count Units Attempted Average Units Fall 2001 Fall 2000 # Change % Change 174 216 -42 -19.4% 568 778 -210 -27.0% 3.26 3.60 Watsonville C/Area Student Count Units Attempted Average Units Fall 2001 Fall 2000 # Change % Change 1838 1433 405 28.3% 8475 6049 2426 40.1% 4.61 4.22 WSCH (residents) Out-of-state Students Fast Track to Work BA+ Degree Students International Students Veterans and Dependents Fall 2001 Fall 2000 # Change % Change 154126.0 143862.3 10263.6841 7.1% 148 145 3 2.1% 307 309 -2 -0.6% 2260 2127 133 6.3% 162 175 -13 -7.4% 65 73 -8 -11.0% Note: International student count includes only those who were enrolled in a class by census date. Enrollment Pattern-Credit Fall 2001 Fall 2000 # Change % Change Day 5700 5517 183 3.3% Evening 3784 3600 184 5.1% Day/Evening 3748 3503 245 7.0% Note: Count-credit students only Note: Data do not include students whose class meeting times are to be arranged. Applications for Admission Fall 2001 9757 Fall 2000 n/a # Change n/a % Change n/a 27370 25984 Fall 2001 Enrollment Status Continuing New Returning Concurrent High School Unreported TOTAL # 8089 3860 863 751 122 13685 % 59.1% 28.2% 6.3% 5.5% 0.9% 100.0% Fall 2000 # 8053 3586 867 349 137 12992 % # Change % Change 62.0% 36 0.4% 27.6% 274 7.6% 6.7% -4 -0.5% 2.7% 402 115.2% 1.1% -15 -10.9% 100.0% 693 5.3% Note: Starting in SP2000, changes in Datatel coding resulted in the shift in numbers compared to numbers from pre-datatel era. Fall 2001 Full/Part-time Full-time Part-time TOTAL Gender Female Male Unknown TOTAL # 3706 9979 13685 27370 Fall 2001 # 142 454 191 157 3055 57 221 9032 376 13685 27370 Fall 2001 # 7921 5750 14 13685 Age <18 18-20 21-25 26-30 31-40 41-50 51-60 >60 Birthday Error Overall Fall 2001 # 718 3466 2962 1505 2086 1707 946 294 1 13685 Race/Ethnicity Categories American Indian Asian African American Filipino Hispanic/Latino Pacific Islander Other White Non-respondents TOTAL Data Source: Computing Resources Querying and Reporting: Planning & Research Office (PRO) % 57.9% 42.0% 0.1% 100.0% Fall 2000 # 3607 9385 12992 25984 Fall 2000 # 148 414 165 169 2810 57 206 8659 364 12992 25984 Fall 2000 # 7542 5311 139 12992 % 5.2% 25.3% 21.6% 11.0% 15.2% 12.5% 6.9% 2.1% 0.0% 100.0% Fall 2000 # 630 3216 2803 1437 2027 1703 822 322 32 12992 % 27.1% 72.9% 100.0% % 1.0% 3.3% 1.4% 1.1% 22.3% 0.4% 1.6% 66.0% 2.7% 100.0% % # Change % Change 27.8% 99 2.7% 72.2% 594 6.3% 100.0% 693 5.3% % # Change % Change 1.1% -6 -4.1% 3.2% 40 9.7% 1.3% 26 15.8% 1.3% -12 -7.1% 21.6% 245 8.7% 0.4% 0 0.0% 1.6% 15 7.3% 66.6% 373 4.3% 2.8% 12 3.3% 100.0% 693 5.3% % # Change % Change 58.1% 379 5.0% 40.9% 439 8.3% 1.1% -125 -89.9% 100.0% 693 5.3% % # Change % Change 4.8% 88 14.0% 24.8% 250 7.8% 21.6% 159 5.7% 11.1% 68 4.7% 15.6% 59 2.9% 13.1% 4 0.2% 6.3% 124 15.1% 2.5% -28 -8.7% 0.2% -31 -96.9% 100.0% 693 5.3% DO NOT PRINT THIS PAGE maroon color is formula driven, do not replace them with values Note: fall2001 age and gender contain non-database corrections. The original data from the database is in the Original&Notes sheet unchanged.


